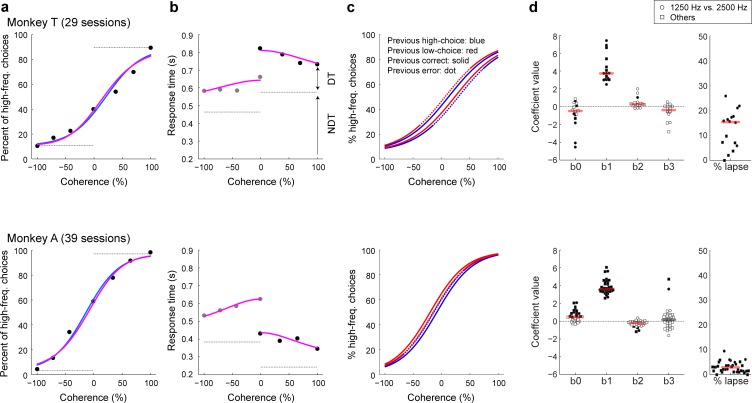
Figure 2. Psychophysical performance on the low-high task.
Psychometric (a) and chronometric (b) functions for Monkey T (top) and Monkey A (bottom). These functions were generated from their responses on the current trial. Psychometric functions are plotted as the percentage of trials in which a monkey chose ‘high frequency’ as a function of signed coherence, in which larger negative/positive coherence values indicate more low/high frequency tone bursts. The horizontal gray lines on the psychometric plots indicate lapse rates (errors for strong stimuli, presumably reflecting lapses in attention or inappropriate application of the decision-motor mapping), which were estimated from logistic fits (solid blue lines). Chronometric functions are plotted using the mean RT, which was the time interval between stimulus onset and onset of joystick movement. Gray dots are low-frequency choices, and black dots are high-frequency choices. Solid pink curves are simultaneous fits of both the psychometric and chronometric data to a drift-diffusion model (DDM). The horizontal dashed gray lines on the chronometric plots indicate choice-dependent non-decision times (NDT) estimated by the DDM fits. Decision times (DT) were estimated as the difference between the trial-specific RT and the choice-specific NDT. (c) Psychometric functions computed separately for different sequential conditions, as indicated in the top panel. (d) Distributions of best-fitting, session-by-session beta coefficients (β0, overall choice bias; β1, sensitivity to coherence; β2, the tendency to repeat a correct choice; and β3, the tendency to repeat an erroneous choice) and lapse rates from the logistic fits. Circles indicate data from sessions using 1250 and 2500 Hz as low and high frequencies, respectively; squares indicate data from other sessions (note that the two conditions corresponded to differences in lapse rates for monkey T but little effect on the other model parameters). Filled data points indicate likelihood-ratio test, H0: regression coefficient equals 0, p<0.05. Horizontal bars indicate median values; red bars indicate Wilcoxon sign-rank test, H0: median value equals 0, p<0.05.

