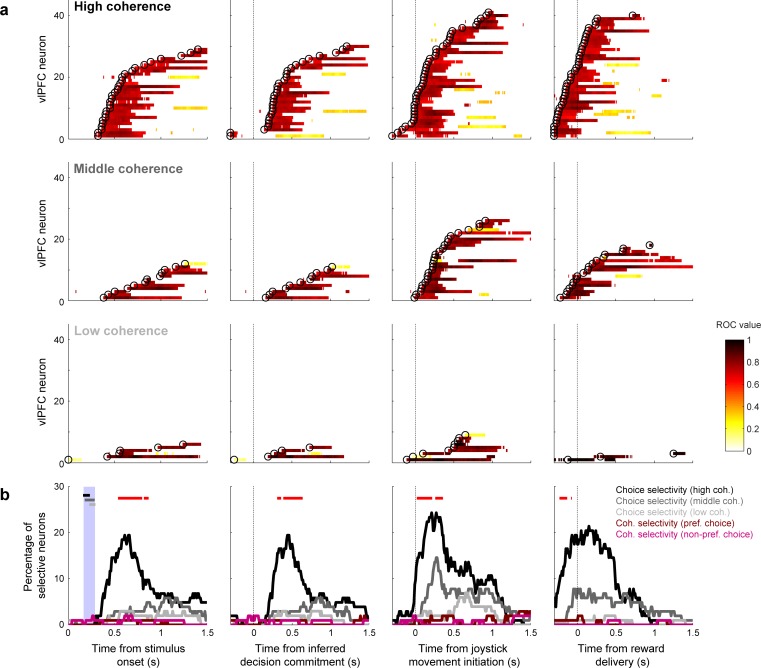
Figure 4. Population selectivity for vlPFC neurons.
(a) Summary of choice selectivity. Data from individual neurons are sorted by the onset of choice selectivity (open circles), defined as the first of three consecutive time bins with reliably different responses for the two choices (Wilcoxon rank-sum test, H0: no median difference in firing rates for the two choices, p<0.05, FDR corrected). Color indicates the ROC value of choice selectivity from correct trials (see legend). Rows show data for high (<−80% versus >+80%), middle (−80% to −20% versus +80% to+20%), and low (−20% to 0 versus 0 to +20%) coherence trials, as indicated. (b) Percentage of neurons with significant selectivity for choice or coherence (Wilcoxon rank-sum test for H0: no median difference in firing rates elicited by high- versus middle- coherence stimuli for each choice, p<0.05, FDR corrected) computed in 300 ms time bins with 10 ms steps. Choice selectivity is shown separately for high, middle, and low coherences, as indicated. Red points indicate times corresponding to a significant difference in the proportion of choice-selective neurons at each coherence level (running χ2-test for H0: proportion is the same, p<0.05, FDR corrected). Coherence selectivity is shown in dark red for preferred choices (i.e., the choice direction that elicits higher firing rates) and light red for non-preferred choices. In the leftmost panel, the horizontal bars represent the range of the inferred times of the decision commitment for high (black), middle (dark gray), and low (light gray) coherence stimuli (the range is indicated by the large vertical bar). In (a) and (b), the data in each panel are aligned relative to different task epochs (from left to right): stimulus onset, inferred decision commitment, onset of joystick movement, and time of reward delivery.

