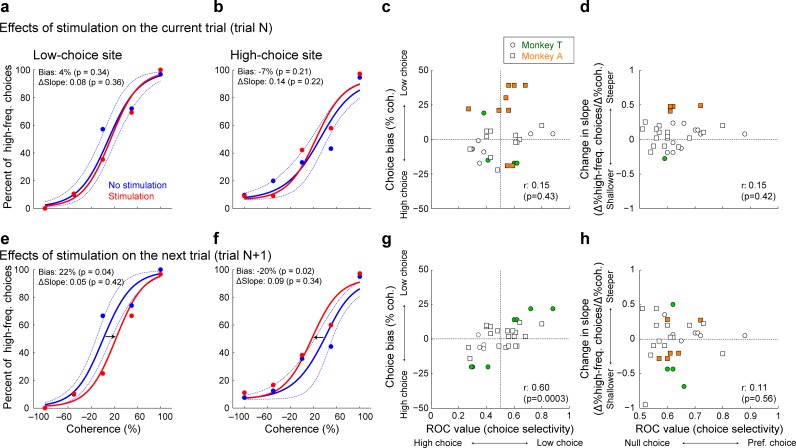
Figure 8. Effect of microstimulation on behavioral performance on the current and next trial.
(a and b) Single-site examples of the effects of vlPFC microstimulation on psychometric performance on the current trial for a low-choice site (a) and a high-choice site (b). Psychometric functions are plotted as in Figure 2. Red/blue symbols are for data from trials with/without microstimulation. Solid lines are logistic fits, computed separately for the two conditions. Dotted lines are 95% confidence intervals of the non-microstimulation trials that were calculated by a bootstrap procedure (Ding and Gold, 2012b). (c and d), Scatterplots showing session-by-session effects of microstimulation on the correlation between neuronal choice selectivity and the percent change in psychometric choice bias (c); Spearman’s rank correlation coefficient ρ = 0.15, p=0.43) and the change in psychometric slope (d); ρ = 0.15, p=0.42) of the current decision. (e and f) Single-site examples of microstimulation’s effects on psychometric performance on the next trial for a low-choice site (e) and a high-choice site (f). The data are formatted in the same manner as panels (a) and (b). (g and h), Scatterplots show session-by-session effects of microstimulation on the correlation between neuronal choice selectivity and the percent change in psychometric choice bias (g; ρ = 0.60, p=0.0003) and the change in psychometric slope (h; ρ = 0.11, p=0.56) of the next decision. Filled data points are significant single-session microstimulation-induced changes in the given psychometric property (permutation test, p<0.05).

