. 2019 May 22;8:e46054. doi: 10.7554/eLife.46054

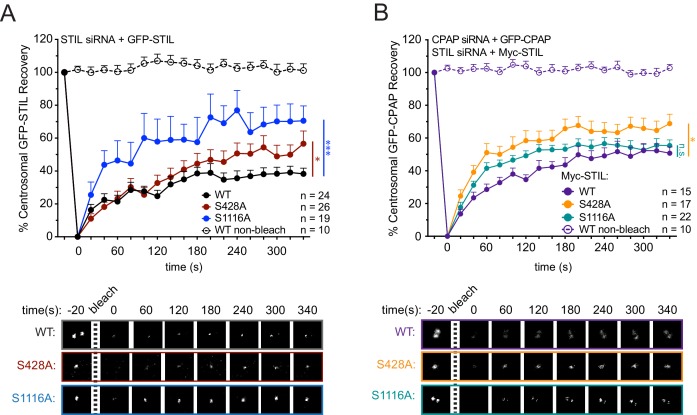
Figure 4. STIL S428 phosphorylation promotes the stable integration of CPAP into the centrosome.

(A) Cells were depleted of endogenous STIL and replaced with the indicated transgene. Myc-GFP-STIL centrosomal foci were photobleached, and fluorescence recovery was measured. The number of quantified photobleaching and recovery events are indicated. Representative timepoints are shown below. Error bars represent the standard error of the mean. (B) Cells were depleted of endogenous STIL and CPAP and replaced with the indicated Myc-STIL-T2A-GFP-CPAP transgene. GFP-CPAP centrosomal foci were photobleached, and fluorescence recovery was measured. The number of quantified photobleaching events is indicated. Representative timepoints are shown below. Error bars represent the standard error of the mean. Asterisks indicate statistically significant differences between measurements (*: p<0.05; **: p<0.005; ***: p<0.0005). Statistics were calculated using an unpaired t-test against the population of recovery measurements between indicated samples at the 340 s timepoint.

Figure 4—source data 1. Figure 4 Data and Statistical Analysis.
DOI: 10.7554/eLife.46054.017
Figure 4—source data 2. Figure 4—figure supplement 1 Data and Statistical Analysis.
DOI: 10.7554/eLife.46054.018
Figure 4—source data 3. Figure 4—figure supplement 2 Data and Statistical Analysis.
DOI: 10.7554/eLife.46054.019

Figure 4.

Figure 4—figure supplement 1. The STIL PRP mutation mimics the turnover dynamics of the STIL S428A mutation.
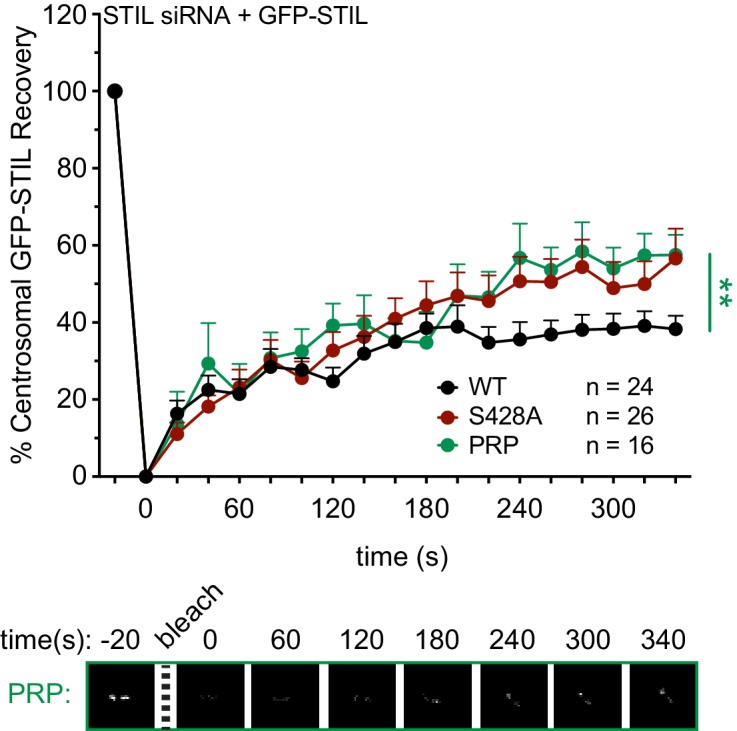
Figure 4—figure supplement 1.

(A) Cells were depleted of endogenous STIL and replaced with the indicated transgene. Myc-GFP-STIL centrosomal foci were photobleached, and fluorescence recovery was measured. The number of quantified photobleaching and recovery events is indicated. Representative timepoints are shown below. Error bars represent the standard error of the mean. Note that ‘WT’ and ‘S428A’ recovery traces are repeated from Figure 4A. Asterisks indicate statistically significant differences between measurements (*: p<0.05; **: p<0.005; ***: p<0.0005). Statistics were calculated using an unpaired t-test against the population of recovery measurements between indicated samples at the 340 s timepoint.
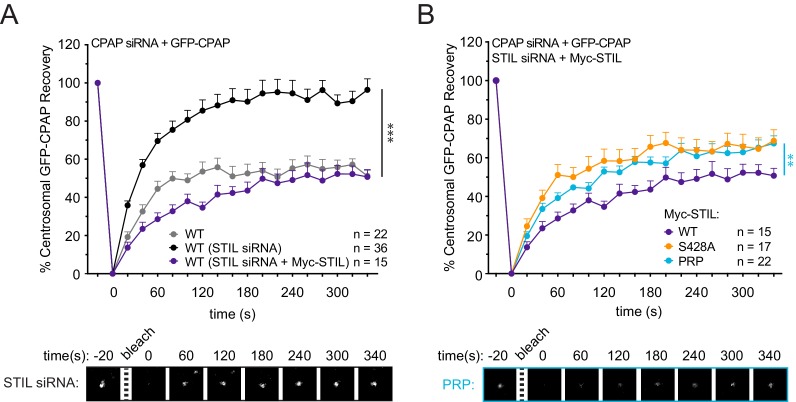
Figure 4—figure supplement 2. Centrosomal CPAP turns over in response to STIL depletion.

Figure 4—figure supplement 2.

(A) Cells were depleted of endogenous CPAP and replaced with a Myc-GFP-CPAP transgene (WT, gray). Cells were depleted of endogenous CPAP and STIL, and CPAP was replaced with either a Myc-GFP-CPAP transgene (WT, STIL siRNA) or a Myc-STIL-T2A-GFP-CPAP transgene (WT, STIL siRNA +Myc STIL). Centrosomal GFP-CPAP foci were photobleached, and fluorescence recovery was measured. Representative timepoints are shown below. Error bars represent the standard error of the mean. (B) Cells were depleted of endogenous STIL and CPAP and replaced with the indicated Myc-STIL-T2A-GFP-CPAP transgene. Centrosomal GFP-CPAP foci were photobleached, and fluorescence recovery was measured. The number of quantified photobleaching and recovery events is indicated. Representative timepoints are shown below. Error bars represent the standard error of the mean. Note that ‘WT’ and ‘S428A’ Myc-STIL recovery traces are repeated from Figure 4B. Asterisks indicate statistically significant differences between measurements (*: p<0.05; **: p<0.005; ***: p<0.0005). Statistics were calculated using an unpaired t-test against the population of recovery measurements between indicated samples at the 340 s timepoint.