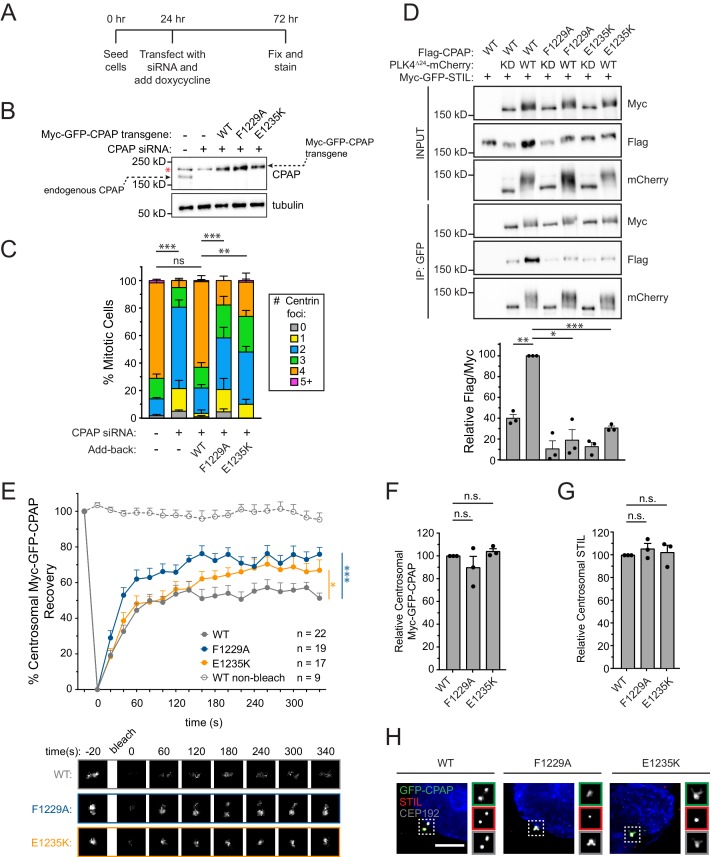
Figure 5. Mutations in the CPAP TCP domain cause less stable CPAP incorporation into the centrosome.
(A) Experimental outline for the CPAP RNAi-replacement experiments. (B) Immunoblot showing the Myc-GFP-CPAP transgene expression levels after knockdown of endogenous CPAP. Note that a background band (denoted by a red asterisk) appears in control lanes that overlaps with the Myc-GFP-CPAP transgene. (C) Quantification showing the number of mitotic Centrin foci in cells depleted of endogenous CPAP and induced to express a siRNA-resistant Myc-GFP-CPAP transgene as indicated. Error bars represent the standard error of the mean across three independent experiments. (D) HEK293FT cells were transfected with the indicated constructs, subjected to co-immunoprecipitation and immunoblotted with the indicated antibodies. Graph represents the mean of relative levels of immunoprecipitated Flag/Myc signal across three independent experiments. A dot indicates the average within each experiment. Error bars represent the standard error of the mean. (E) Cells were depleted of endogenous CPAP and replaced with the indicated transgene. Myc-GFP-CPAP centrosomal foci were photobleached, and fluorescence recovery was measured. The number of quantified photobleaching and recovery events is indicated. Error bars represent the standard error of the mean. Representative timepoints are shown below. Note that ‘WT’ trace is repeated from Figure 4—figure supplement 2A. (F) Quantification of the relative centrosomal levels of Myc-GFP-CPAP from S/G2 phase cells with at least 40 cells measured per experiment. Bars represent the mean of at least three independent experiments with the average within each experiment shown as a dot. Error bars represent the standard error of the mean. (G) Quantification of the relative centrosomal levels of STIL from S/G2 phase cells with at least 40 cells measured per experiment. Bars represent the mean of at least three independent experiments with the average within each experiment shown as a dot. Error bars represent the standard error of the mean. (H) Representative images from data quantified in (F) and (G). Scale bar represents 5 µm. Asterisks indicate statistically significant differences between measurements (*: p<0.05; **: p<0.005; ***: p<0.0005). For Figure 5C, statistics were calculated using an unpaired t-test against the fraction of cells containing less than four centrioles in mitosis. For Figure 5D,F and G, statistics were calculated using a one-sample t-test where mean values were tested as being different from a value of 100. For Figure 5E, statistics were calculated using an unpaired t-test against the population of recovery measurements between indicated samples at the 340 s timepoint.


