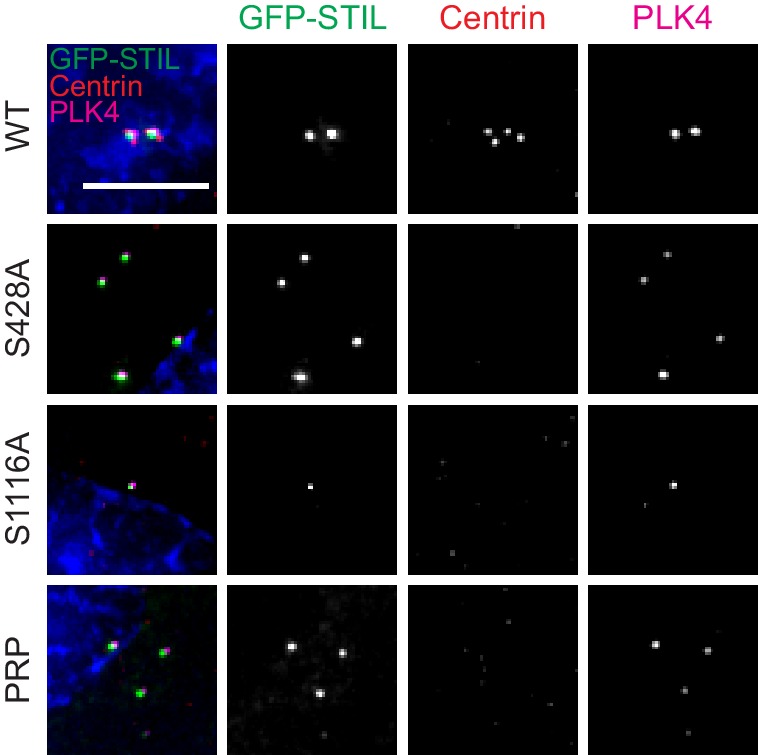
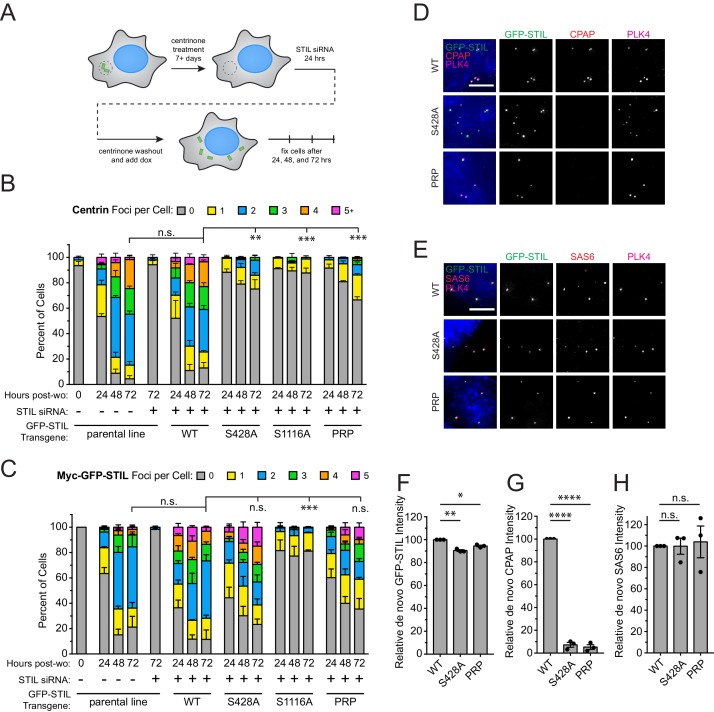
Figure 6. STIL S428 phosphorylation is required for recruitment of CPAP to de novo centrioles.
(A) Experimental outline for de novo centriole assembly assay. DLD-1 cells were maintained in 500 nM centrinone for seven or more days to deplete centrioles, and then endogenous STIL was knocked down with siRNA. Twenty-four hours later, centrinone was washed out, and the expression of a siRNA-resistant Myc-GFP-STIL transgene was induced with doxycycline. Cells were analyzed at 24, 48, and 72 hr post-centrinone washout. (B) Quantification showing the number of Centrin foci in interphase cells under the indicated conditions. Bars represent the mean of three independent experiments in which at least 40 cells were counted per condition. Error bars represent the standard error of the mean. ‘Post-wo’ refers to post-washout. A Centrin focus was counted as a de novo centriole if it overlapped with a PLK4 focus (see Figure 5—figure supplement 1). (C) Quantification showing the number of Myc-GFP-STIL foci, or endogenous STIL foci in parental line, in cells under the indicated conditions. ‘Post-wo’ refers to post-washout. Bars represent the mean of three independent experiments in which at least 40 cells were counted per condition. Error bars represent the standard error of the mean. (D) Representative images of de novo centriole formation showing CPAP localization. Cells were fixed at 24 hr post-centrinone washout. Scale bar represents 5 µm. (E) Representative images of de novo centriole formation showing SAS6 localization. Cells were fixed at 24 hr post-centrinone washout. Scale bar represents 5 µm. (F–H) Quantification of the relative localization of (F) Myc-GFP-STIL, (G) CPAP, and (H) SAS6 at de novo centrioles at 24 hr post-centrinone washout. Bars represent the mean of three independent experiments in which at least 40 cells were quantified per mutant, and a dot indicates the average within each experiment. Error bars represent the standard error of the mean. Asterisks indicate statistically significant differences between measurements (*: p<0.05; **: p<0.005; ***: p<0.0005; ****: p<0.0001). For Figure 6B and C, statistics were calculated using an unpaired t-test against the fraction of cells containing no Centrin foci or GFP-STIL foci, respectively, after 72 hr post-washout. For Figure 6F,G and H, statistics were calculated using a one-sample t-test where mean values were tested as being different from a value of 100.
Figure 6—figure supplement 1. De novo centriole formation requires phosphorylation of STIL S428 and S1116 by PLK4.


