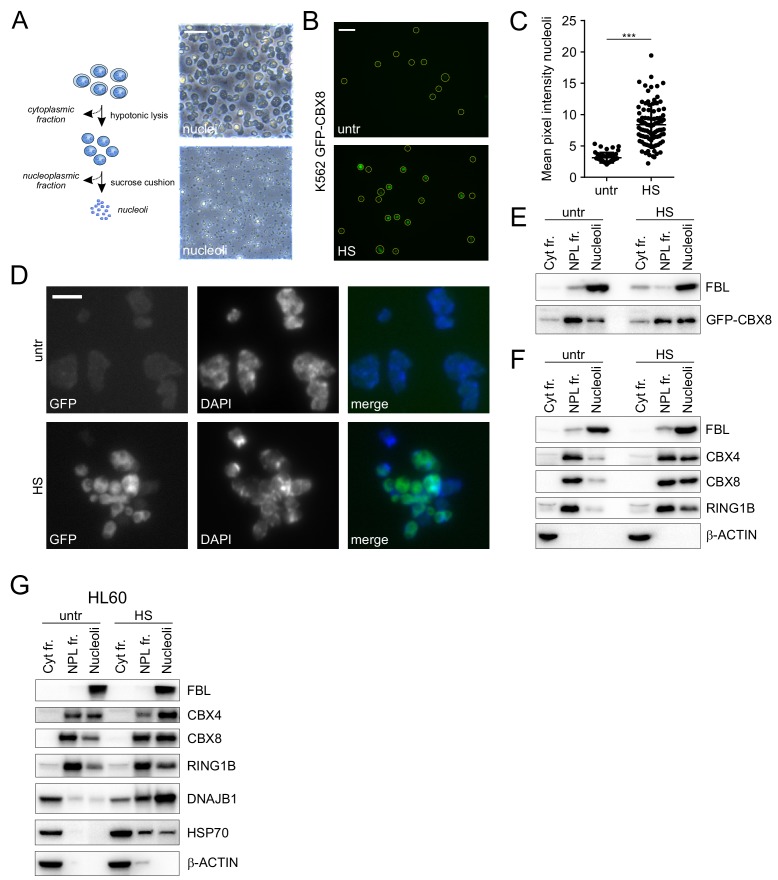
Figure 2. Cellular fractionation shows HS-induced nucleolar relocalization of endogenous Polycomb proteins.
(A) Graphical representation of isolation of cytoplasmic, nucleoplasmic and nucleoli fractions and transmission images of isolated nuclei and nucleoli. Scale bar represents 40 μm. (B) Representative images of non-fixed nucleoli isolated from untreated or heat-shocked (1 hr, 44°C) K562 GFP-CBX8 cells. Scale bar represents 10 μm. (C) Quantification of the GFP-CBX8 fluorescent signal of nucleoli isolated form untreated (n = 47) or heat-shocked (n = 92) cells. Error bars indicate mean ± SEM. Statistical analysis was performed using Student’s t-test, ***p<0.001. (D) Representative image from fixed nucleoli isolated from untreated or heat-shocked (1 hr, 44°C) K562 GFP-CBX8 cells and counterstained with DAPI. Scale bar represents 5 μm. (E) Western blot analyses of cytoplasmic, nucleoplasmic and nucleoli fractions from untreated and heat-shocked K562 GFP-CBX8 cells stained with anti-Fibrillarin (FBL) and anti-GFP antibodies. (F) Western blot analyses of cytoplasmic, nucleoplasmic and nucleoli fractions from untreated and heat-shocked K562 cells stained with anti-Fibrillarin (FBL), anti-CBX4, anti-CBX8, anti-RING1B and anti-β-ACTIN antibodies. (G) Western blot analyses of cytoplasmic, nucleoplasmic and nucleoli fractions from untreated and heat-shocked HL60 cells stained with anti-Fibrillarin (FBL), anti-CBX4, anti-CBX8, anti-RING1B, anti-DNAJB1, anti-HSP70 and anti-β-ACTIN antibodies.

