. 2019 Jun 14;8:e45205. doi: 10.7554/eLife.45205

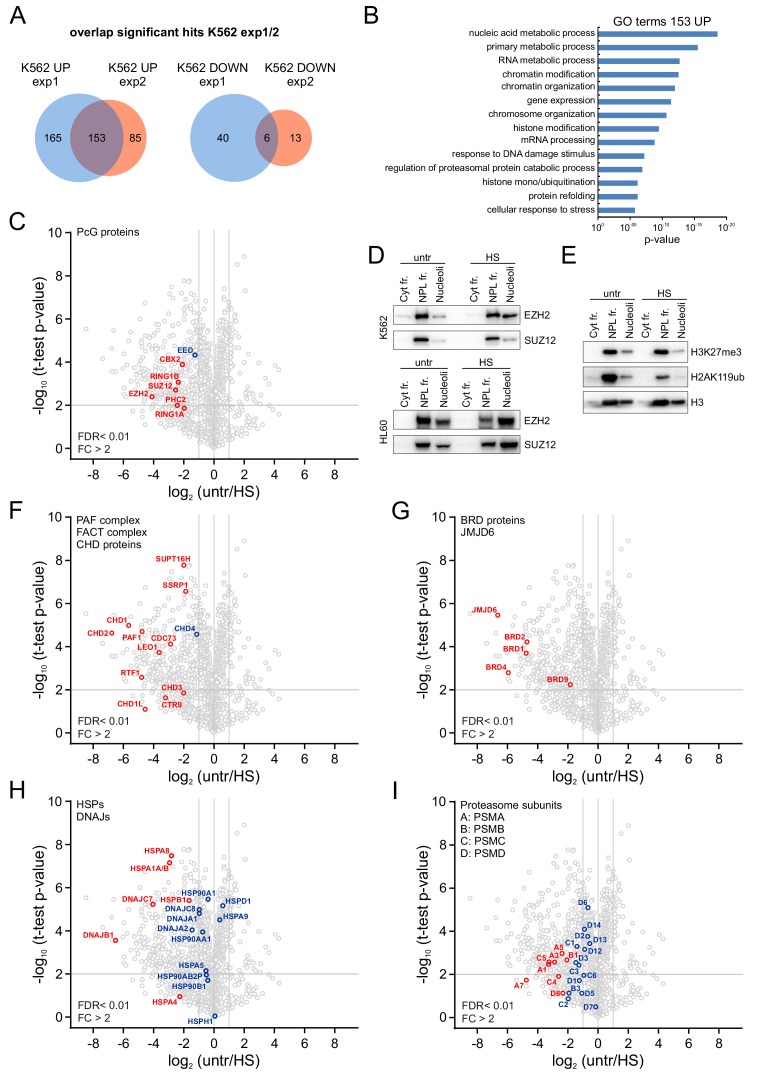
Figure 3. Heat shock induces nucleolar accumulation of Polycomb proteins, chromatin regulators and heat-shock proteins.

(A) Venn diagrams showing overlap of significantly enriched/depleted proteins in nucleoli after HS (1 hr, 44°C) as identified in two independent experiments. Nucleolar fractionations were performed on K562 cells (untreated, HS) and samples were analyzed using liquid chromatography-tandem mass spectrometry (LC-MS/MS) in triplicates, followed by data analysis using MaxQuant and Perseus software. (B) Gene ontology (GO) analysis of overlapping proteins that were significantly enriched in the nucleolus after HS. (C) Volcano plot showing nucleolar proteins in untreated and heat shocked K562 cells and highlighting enriched PRC1 and PRC2 subunits. Statistical analysis was performed using Student’s t-test (false discovery rate (FDR) < 0.01; fold change (FC) > 2). Significantly changed proteins are marked in red. (D) Western blot analyses of cytoplasmic, nucleoplasmic and nucleoli fractions from untreated and heat-shocked K562 and HL60 cells stained with anti-EZH2 and anti-SUZ12 antibodies. (E) Western blot analyses of cytoplasmic, nucleoplasmic and nucleoli fractions from untreated and heat-shocked K562 cells stained with antibodies directed against histone H3, H3K27me3 and H2AK119ub. (F) Volcano plot showing (significantly) enriched subunits of the PAF and FACT complex and CHD proteins. (G) Volcano plot displaying significantly enriched BRD family members and the JMJD6 protein. (H) Volcano plot showing (significantly) enriched HSP70 and DNAJ heat shock proteins. (I) Volcano plot highlighting all (significantly) enriched proteasomal subunits.

Figure 3.

Figure 3—figure supplement 1. LC-MS/MS analysis of isolated nucleoli shows enrichment for nucleolar proteins.
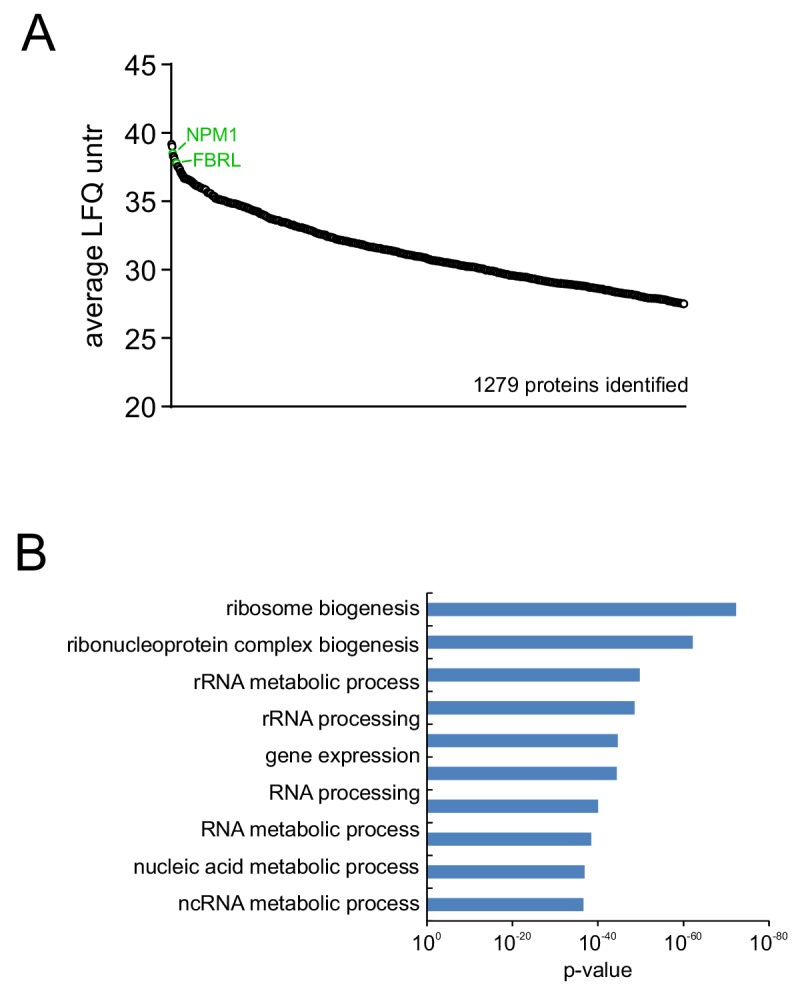
Figure 3—figure supplement 1.

(A) Ranking of proteins based on LFQ value shows that classical nucelolar proteins like NPM1 and Fibrillarin (both indicated in green) are among the top enriched proteins in nucleoli. (B) GO analysis of the top ten percent (based on LFQ value) of identified proteins, shows enrichment for nucleolus-related processes like ribosome biogenesis and rRNA processing.
Figure 3—figure supplement 2. LC-MS/MS-based identification of significantly changed proteins in the nucleolus upon heat shock.

Figure 3—figure supplement 2.

(A) Scatter plots from two independent experiments showing average LFQ values, based on triplicate measurements, for each identified protein in nucleoli isolated from untreated or heat shocked K562 cells. Red circles indicate all significantly changed proteins after HS. NPM1 and Fibrillarin are indicated in green. (B) Volcano plot showing nucleolar proteins in untreated and heat shocked K562 cells and highlighting PRC1 and PRC2 subunits that were detected. Statistical analysis was performed using Student’s t-test (false discovery rate (FDR) < 0.01; fold change (FC) > 2). Significantly changed proteins are marked in red. (C) Volcano plot highlighting (significantly) enrichedsubunits of the PAF and FACT complex and CHD proteins. (D) Volcano plot showing (significantly) enriched BRD family members and the JMJD6 protein. (E) Volcano plot displaying (significantly) enriched HSP70 and DNAJ heat shock proteins. (F) Volcano plot highlighting all (significantly) enriched proteasomal subunits.
Figure 3—figure supplement 3. HS induces nucleolar accumulation of EZH2 in leukemic cells and primary human peripheral blood stem cells.

Figure 3—figure supplement 3.

(A–C) Confocal images of immunofluorescence staining of endogenous EZH2 and NPM1 in untreated and heat shocked (44°C) HL60 (A), K562 (B) and mobilized peripheral blood stem cells (mPBSCs; C). Scale bar represents 10 μm.
Figure 3—figure supplement 4. Identification of changes in the nucleolar proteome in untreated and heat shocked K562 GFP-CBX8 cells.

Figure 3—figure supplement 4.

(A) Volcano plot from nucleolar proteomes from untreated and heat shocked K562 GFP-CBX8 cells highlighting PRC1 and PRC2 subunits that were detected in the isolated nucleoli. Statistical analysis was performed using Student’s t-test (false discovery rate (FDR) < 0.01; fold change (FC) > 2). Significantly changed proteins are marked in red. (B) Volcano plot highlighting (significantly) enriched subunits of the PAF and FACT complex and CHD proteins. (C) Volcano plot showing (significantly) enriched BRD family members and the JMJD6 protein. (D) Volcano plot displaying (significantly) enriched HSP70 and DNAJ heat shock proteins. (E) Volcano plot highlighting all (significantly) enriched proteasomal subunits.