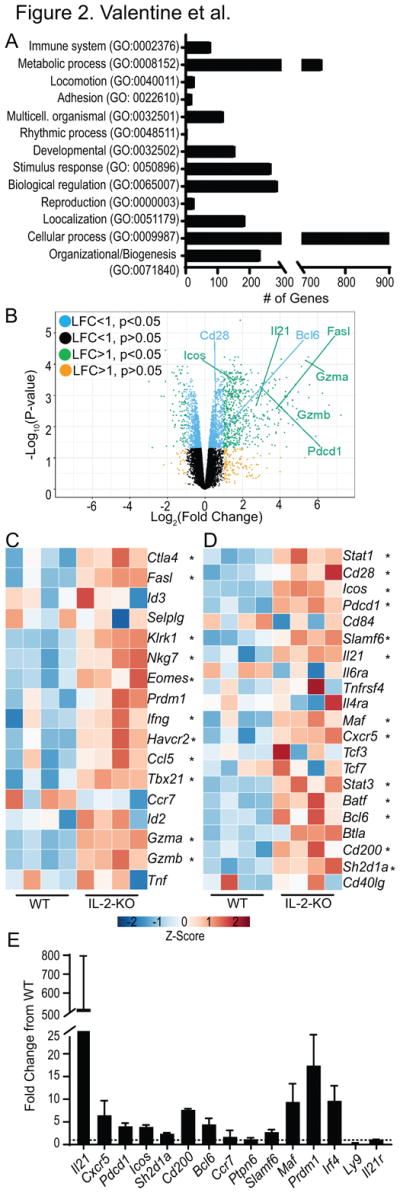
Fig. 2. Cytolytic and follicular helper profile of IL-2-KO CD8 T cells.

RNA sequencing of four independent WT and IL-2-KO CD8 T cell samples pooled from LN of 12 day old mice. (A) Gene ontology analysis of all 2226 differentially expressed genes in IL-2-KO CD8 T cells relative to WT. (B) Volcano plots displaying log2 fold change gene expression of IL-2-KO relative to WT CD8 T cells versus log10 p-value. Select differentially expressed genes are labeled in the plot. Data is organized by color to indicate both log fold change (LFC) and p-value. (C, D) Heat maps showing CD8 T cell expression data. Color indicates gene expression by Z-score, * indicates IL-2-KO gene expression with statistical significance relative to WT. Differential expression of select cytolytic-associated genes (C), and CD4 T follicular helper-associated genes (D). (E) mRNA expression of select genes in two independent experiments from 12 day old IL-2-KO CD8 T cells relative to WT CD8 T cells. Dashed line indicates a fold change of 1, error bars indicate standard deviation.
