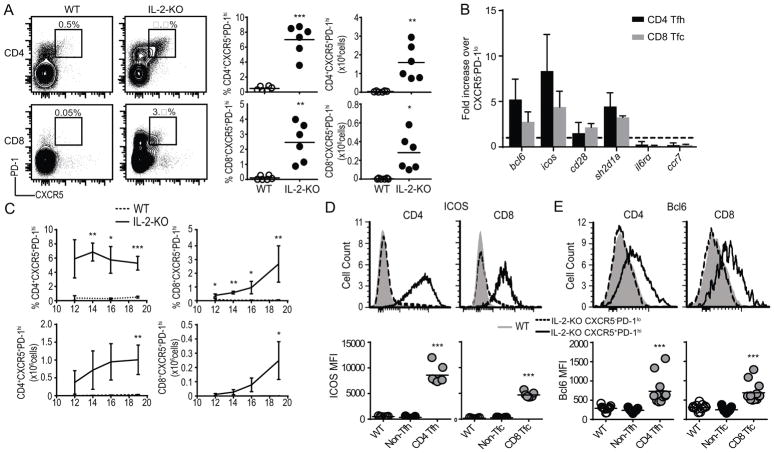
Fig. 3. CD8 T cells express markers of follicular helpers.
(A) Flow cytometric analysis of CXCR5 and PD-1 expression on CD4 or CD8 T cells from 18–21 day old IL-2-KO or WT LN gated on B220−CD11c−CD11b−GR-1−. Representative flow plots, frequency, and total number of CXCR5+PD-1hi CD4 and CD8 T cells are shown. (B) RT-PCR comparing relative gene expression in IL-2-KO CD4 Tfh or CD8 Tfc cells (CXCR5+PD-1hi) to IL-2-KO CD4 CXCR5−PD-1lo (non-Tfh) or CD8 CXCR5−PD-1lo (non-Tfc) cells respectively. Dashed line indicated fold change of 1, error bars indicate standard deviation. (C) Percent and total number of CD4 Tfh and CD8 Tfc cells in IL-2-KO and WT mice from 12–20 days of age. (D, E) Representative flow plots and mean fluorescence intensity (MFI) quantification of surface expression of ICOS (D) and Bcl6 (E) in WT naïve bulk CD4 and CD8 T cells, IL-2-KO CD4 non-Tfh or CD8 non-Tfc, and IL-2-KO CD4 Tfh and CD8 Tfc cells. (A, D–E) Each symbol indicates an individual animal. (A, C–E) Data is representative of 3–6 independent experiments. (B) Data is representative of 2 independent experiments. Statistics: unpaired Student’s t-test relative to WT with a Welch correction; * p<0.05; ** p<0.01, *** p≤0.001.

