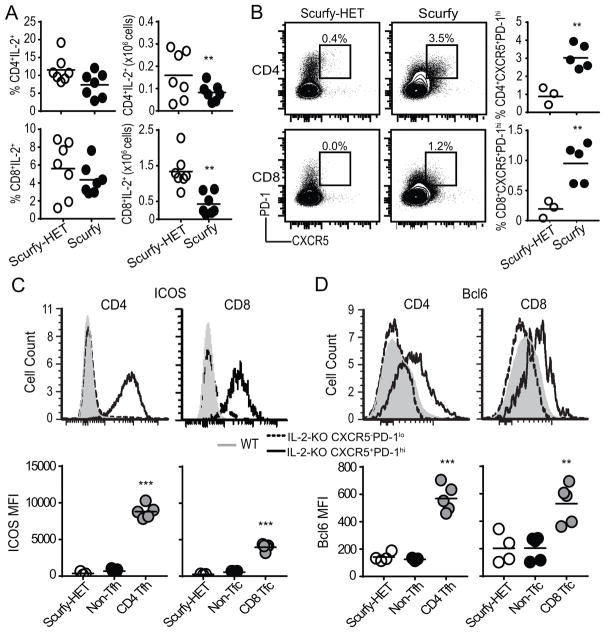
Fig. 4. Autoimmune Scurfy mice develop CD8 Tfc cells.
Flow cytometric analysis of Scurfy and Scurfy-HET littermate control LNs, (A) Quantification of IL-2 producing CD4 and CD8 T cell frequency and total cell number after PMA and ionomycin stimulation. (B) CXCR5 and PD-1 expression on CD4 or CD8 T cells from 18–19 day old Scurfy or scurfy-HET gated on live B220−CD11c−CD11b−GR-1−. Representative flow plots, frequency, and total number of CXCR5+PD-1hi CD4 and CD8 T cells are shown. (C, D) Representative flow plots and quantification of MFI of expression of ICOS (C) and Bcl6 (D) in Scurfy-HET naïve bulk CD4 and CD8 T cells, Scurfy CD4 non-Tfh or CD8 non-Tfc, and Scurfy CD4 Tfh and CD8 Tfc (CXCR5+PD-1hi) following stimulation with PMA and ionomycin. Each symbol indicates an individual animal. Data is representative of 3–6 independent experiments. Statistics: unpaired Student’s t-test relative to scurfy-HET (A–B, D) with a Welch correction in (C): * p<0.05; *** p≤0.001.

