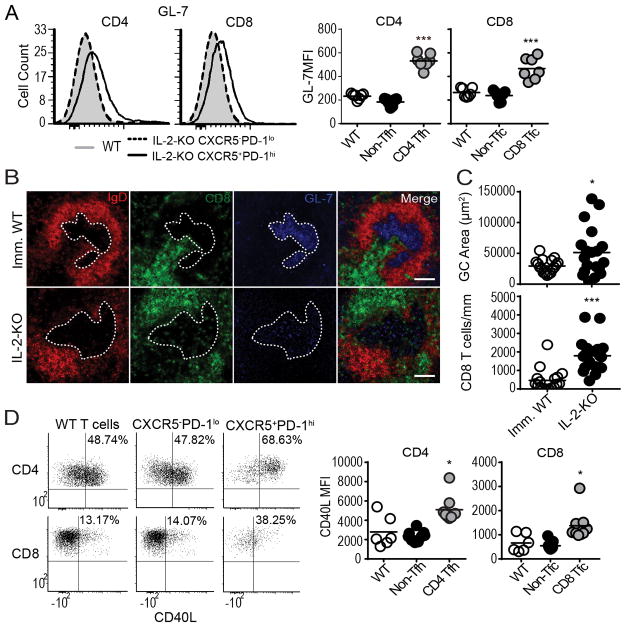
Fig. 5. CD8 T cells localize to the GC during autoimmune disease.
(A) Representative flow plots and MFI quantification of GL-7 expression IL-2-KO and WT splenocytes in the indicated populations. (B) Immunoflourescence staining of B cells (red, IgD), GCs (blue, GL-7), and CD8 (green, CD8α) of spleens from 18–21 day old IL-2-KO and KLH-immunized WT (Imm. WT) mice. White dotted lines indicate the GC outline and white measurement bar indicated 100 μm. (C) Quantification of GC area (μm2) and CD8 T cell (per mm2). (D) Representative flow plots and MFI quantification of CD40L expression in IL-2-KO and WT CD4 and CD8 T cells stimulated with PMA and ionomycin. (A, C–D) Each symbol indicates an individual animal. (A) Data from 4 independent experiments. (B–C) Data are representative of 5 spleens and 19 GCs from IL-2-KO mice or 4 spleens and 17 GCs in KLH imm. WT mice. (D) Data are representative of three independent experiments. Statistics: unpaired Student’s t-test relative to WT (A) with a Welch correction in (C–D); * p<0.05; *** p≤0.001.

