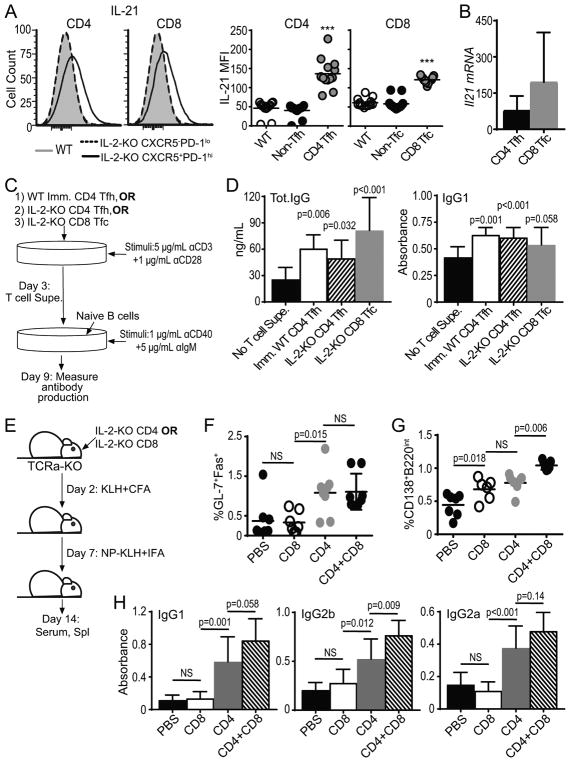
Fig. 6. IL-2-KO CD8 Tfc cells promote antibody class-switch by B cells.
(A) IL-2-KO and WT lymphocytes were stimulated with PMA and ionomycin. CD8 and CD4 T cells were gated on the indicated populations and analyzed for IL-21 expression by flow cytometry. (B) IL-21 mRNA expression in sorted IL-2-KO CD4 Tfh or CD8 Tfc cells relative to IL-2-KO CD4 non-Tfh or CD8 non-Tfc respectively. (C) Schematic describing the assay for T cell stimulation and B cell antibody induction. B cell supernatant was analyzed for total IgG and IgG1 by ELISA. (D) Total IgG concentration or IgG1 levels of stimulated B cells with and without stimulated IL-2-KO CD4 Tfh, IL-2-KO CD8 Tfc, or Imm. WT CD4 Tfh supernatants were determined by ELISA. (E) Schematic describing IL-2-KO T cell transfer and B cell induction. Sorted IL-2-KO CD4 or CD8 T cells were adoptively transferred to TCRα-KO mic, immunized with KLH in CFA and reimmunized with NP-KLH in IFA. (F) B220+GL-7+Fas+ GC B cells frequency and (G) B220intCD138+ plasma cell frequency from TCRα-KO recipient spleens. (H) IgG1, IgG2b and IgG2a levels determined by ELISA from TCRα-KO recipient serum. (A, F, G) Each symbol indicates an individual animal. Data representative of in 4–6 independent experiments. Statistics: unpaired Student’s t-test relative to WT with a Welsh correction (A) and ordinary one-way ANOVA with select comparisons and a Bonferroni correction (D, F–H); NS= not significant, * p<0.05; ** p<0.01, *** p≤0.001.

