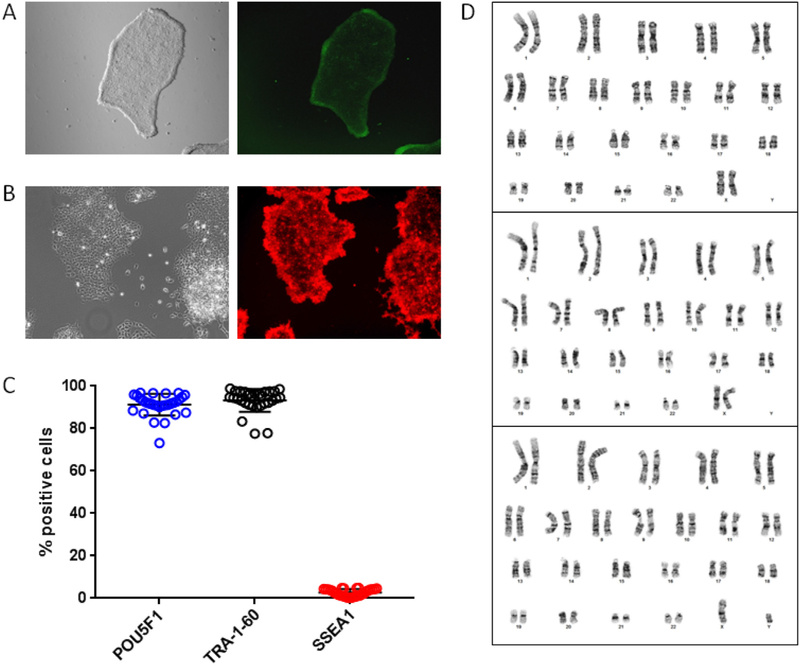
Fig. 1.
Validation of blood-derived human iPSCs. Live stain of representative iPSC colonies showing A) alkaline phosphatase activity, and B) SSEA-4 expression. C) Flow cytometry analysis of pluripotency markers POU5F1 and TRA-1–60, and differentiation marker SSEA-1 in iPSCs (mean ± SD, n = 30). See also Fig. S1 for flow cytometry data on isotype controls. D) Karyotype analysis of three iPSC lines showed normal chromosomal content. See also Fig. S2 for additional characterization of pluripotency marker expression and genomic aberrations.

