. 2019 May 28;8:e47040. doi: 10.7554/eLife.47040

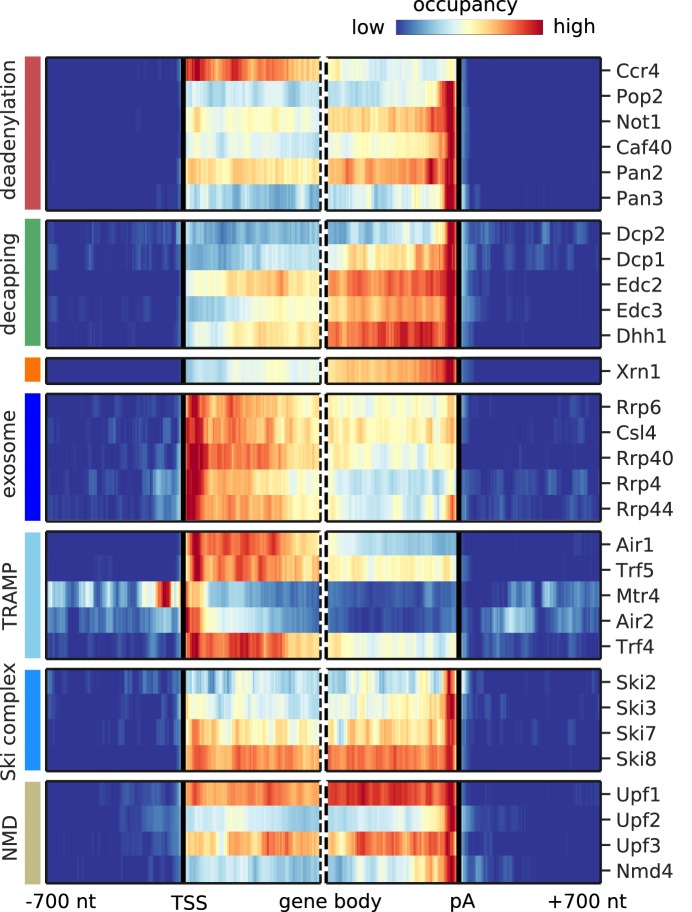
Figure 3. Metagene analysis of degradation factor binding on mRNAs.

Averaged occupancy profiles of degradation factors over mRNAs aligned around their transcription start site (TSS) (n = 3,193, left) and around their poly-adenylation (pA) site (n = 3,193, right) in a window of [±700 nt]. Regions that have neighboring transcripts on the same strand were removed to avoid contaminating profiles (Materials and methods). Factors are grouped according to their functional role; from top to bottom: deadenylation, decapping, Xrn1, exosome, TRAMP complex, Ski complex, or NMD. The color code shows the average occupancy normalized between the minimum (blue) and maximum (red) values per profile.

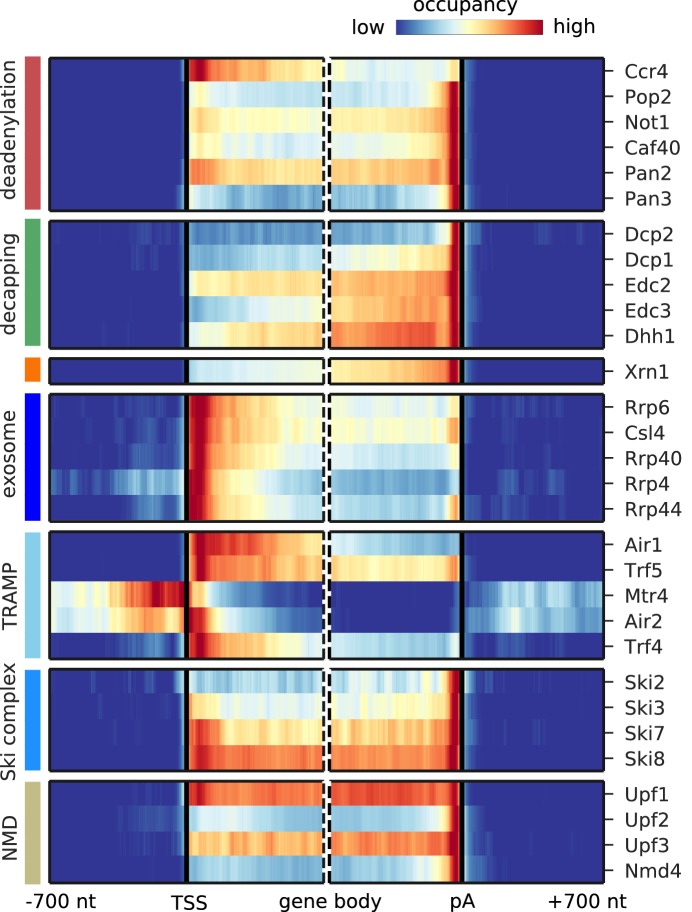
Figure 3.

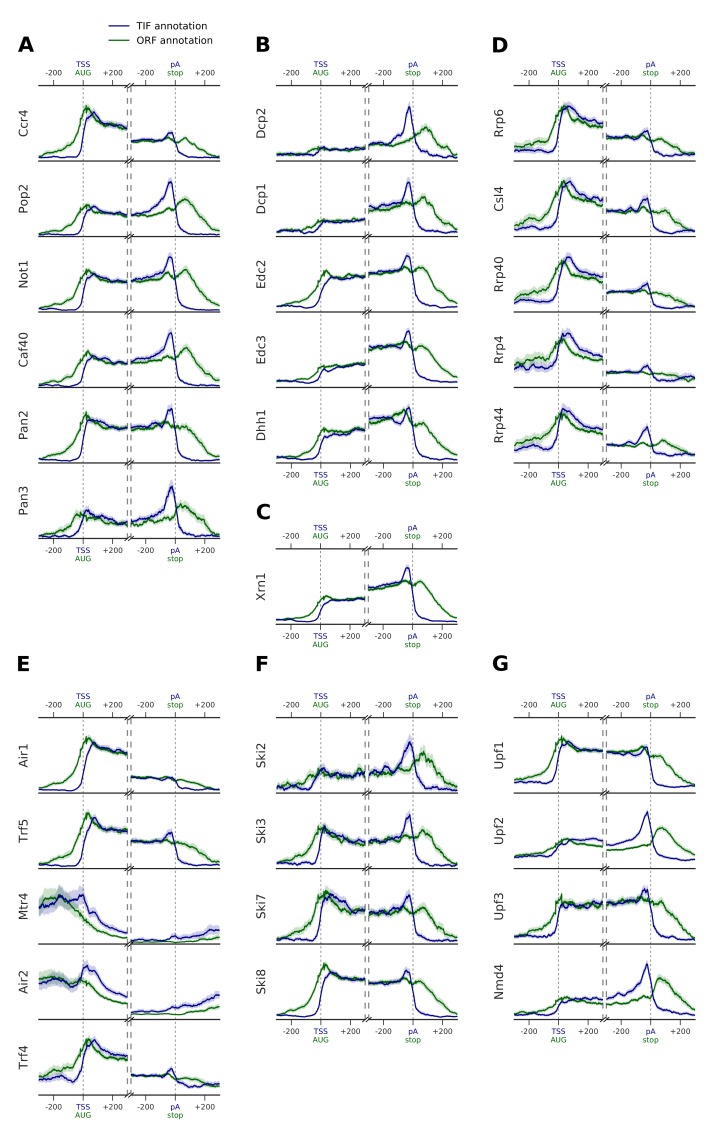
Figure 3—figure supplement 1. Metagene profiles of yeast RNA degradation factors centered on translation start and stop sites in comparison to TIF-annotated TSS and pA sites.

Figure 3—figure supplement 1.

Transcript-averaged PAR-CLIP occupancy profiles are shown for RNA degradation factors involved in (A) deadenylation, (B) decapping, (C) 5´→3´ exonuclease Xrn1, (D) exosome, (E) TRAMP, (F) Ski, and (G) NMD. Transcripts are aligned either at transcript start site (TSS) and poly-adenylation (pA) site (marked with blue) or at their start and stop codons (marked with green). TIF-seq based annotation is shown in blue (n = 3193 for TSS and pA site profiles) (Pelechano et al., 2013). Open reading frames (ORF) annotated in the SGD (version 64.2.1) are shown in green (n = 4012 for TSS, and n = 3965 for pA site selected transcripts). To avoid contaminating signals from neighboring genes, we filtered out regions that had annotations upstream and downstream of the centered gene (up to 700 nt) (Materials and methods). Shaded areas (in blue TIF-seq annotation, or in green for ORF annotation) depict 95% confidence intervals derived from bootstrapping genes. Comparison between these two profiles highlights preferences for end binding degradation factors in binding to untranslated regions at the two sides of the transcript.
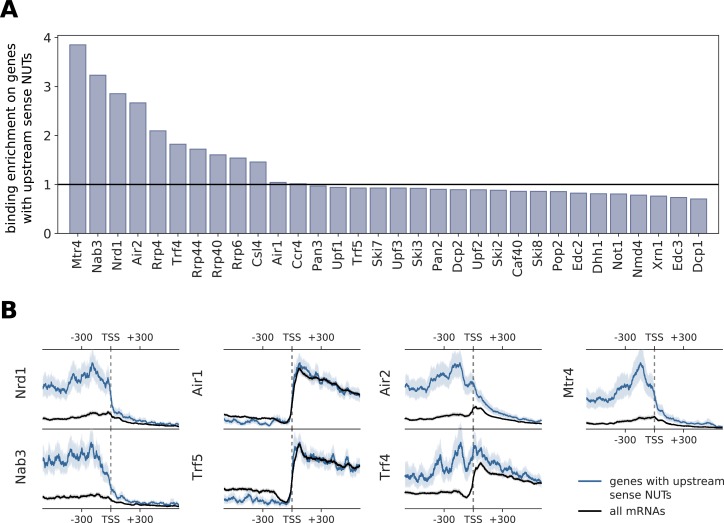
Figure 3—figure supplement 2. Comparison of binding profiles on genes containing annotated upstream sense NUTs with all mRNAs.

Figure 3—figure supplement 2.

(A) Binding enrichment of degradation factors around the TSS of genes with an upstream sense NUT. Enrichment is defined as the ratio of the average occupancy in the interval [±300 nt] of the TSS on these genes that contain an upstream NUT (n = 459) (Schulz et al., 2013) divided by the average occupancy on all genes. (B) Transcript-averaged PAR-CLIP occupancy profiles for all mRNAs (black) is compared to patterns derived from genes with upstream sense NUTs (blue). Transcripts were aligned at their TSS and averaged over the interval of [±600 nt]. We compared Nrd1 and Nab3 profiles, known to process NUTs, with subunits of the TRAMP complex. 95% confidence intervals obtained from bootstrapping genes are shown with gray and blue shades.
Figure 3—figure supplement 3. Metagene analysis of degradation factor binding on mRNAs after removing signals from known NUTs and CUTs.

Figure 3—figure supplement 3.

Cross-link sites were filtered to exclude regions that were previously annotated as NUTs and CUTs (Neil et al., 2009; Schulz et al., 2013). Averaged occupancy profiles of degradation factors are then shown over mRNAs aligned around their transcription start site (TSS) (n = 3,193, left) and around their poly-adenylation (pA) site (n = 3,193, right) in a window of [±700 nt]. Regions that have neighboring transcripts on the same strand were removed to avoid contaminating profiles (Materials and methods). Factors are grouped according to their functional role; from top to bottom: deadenylation, decapping, Xrn1, exosome, TRAMP complex, Ski complex, or NMD. The color code shows the average occupancy normalized between the minimum (blue) and maximum (red) values per profile.