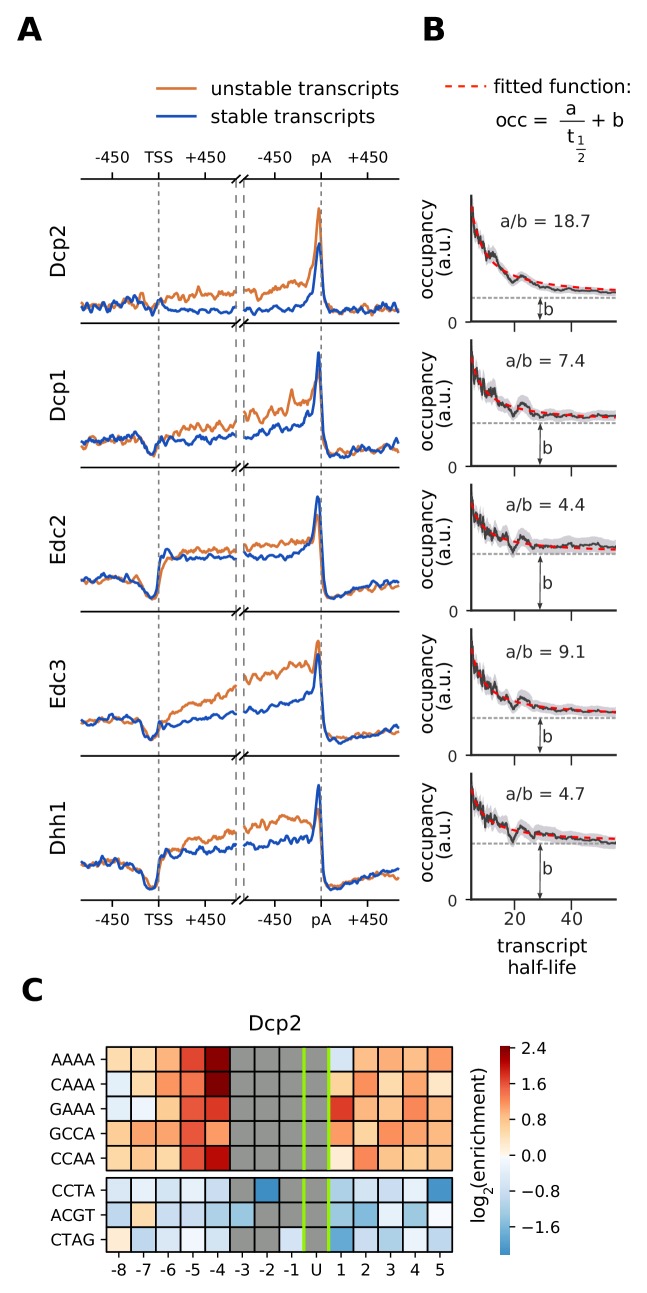
Figure 7. Location and recruitment of the decapping complex Dcp1/Dcp2 and decapping enhancers Edc3, Dhh1, and Edc2.
(A) Smoothed, transcript-averaged PAR-CLIP occupancy profiles aligned at TSS and pA sites [±750 nt] of unstable and stable transcripts (first and fourth quantile of half-life distribution, respectively). (B) Dependence of total occupancy of factors on the transcripts half-life. The fitting function is plotted in red and the fitted value for b is marked with a dashed gray line. (Gray shade: 95% confidence intervals generated by bootstrapping transcripts). (C) Sequence binding preference for the catalytically active subunit of decapping complex (Dcp2), illustrated with the five most enriched and the 3 most depleted 4-mers. The color code shows the log2 enrichment factor of 4-mers around PAR-CLIP cross-link sites [±8 nt]. Dark red represents strong enrichment and dark blue shows strong depletion of a 4-mer. Infeasible combinations are shown with gray. The most highly enriched field is binding AAAAU with the cross-link at the U, which is enriched over random expectation approximately 22.3 = 5-fold.

