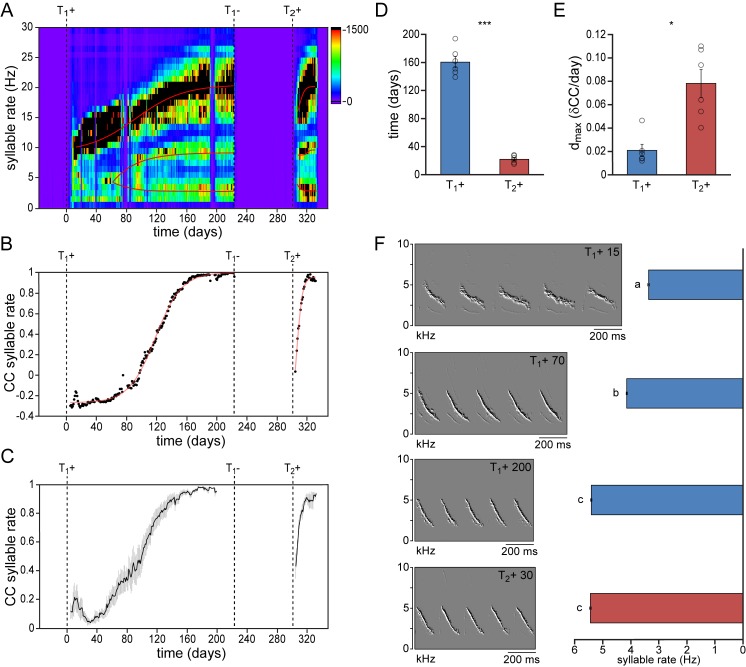
Figure 2. Syllable repetition rates develop faster in birds with prior singing experience.
(A) Syllable rate histogram from a female canary during two subsequent testosterone treatments. Color scales indicate the number of daily syllables produced for each discrete syllable rate. Curves were fitted through the most occurring syllable rates and are shown in red. (B) The correlation coefficient (CC) between the stabilized distribution of syllable rates at the end of the 1st testosterone treatment and each other day during the development and re-development of song in the same bird as shown in A. (C) The mean syllable rate correlation plot for all animals. Grey bars indicate the SEM. (D) Group statistics of all studied birds demonstrating that stable syllable rates were achieved more quickly during a 2nd testosterone treatment (red bars) than during the 1st treatment (blue bars). (E) The peak day-to-day increase in the syllable rate CC (dmax) was higher during a 2nd testosterone treatment than during the 1st treatment. (F) Example spectral derivative spectrograms from one bird and corresponding bar graphs illustrating syllable rates at 15, 70, and 200 days after a 1st testosterone treatment and 30 days after a 2nd treatment. Columns in D-E represent the mean ± SEM and open circles indicate individual data points (*p<0.05, ***p≤0.001, paired t-test, n = 6 animals). Columns in F represent the mean ± SEM (a,b,c: p≤0.001, ANOVA; n = 100 syllables). Source data for temporal song features are available in the Figure 2—source data 1.


