. 2019 May 17;8:e43194. doi: 10.7554/eLife.43194

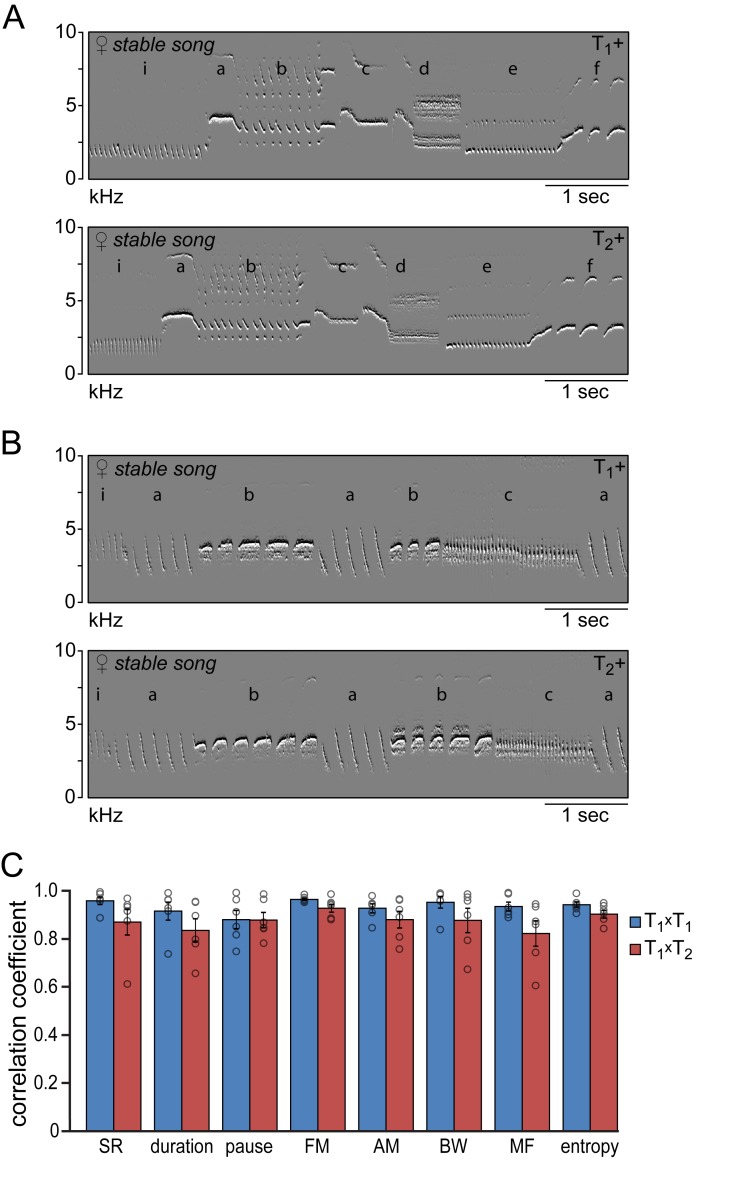
Figure 4. Similarity of time and frequency parameters after subsequent testosterone treatments.

(A,B) Example spectral derivative spectrograms of stable song from two animals during the 1st (T1+) and 2nd (T2+) testosterone treatment illustrating a strong similarity in song structure. (C) Similarity analyses between stable song patterns from the 1st and 2nd testosterone treatment periods (T1xT2, red bars) demonstrated a high level of correlation of more than 80% for all analyzed song features. Correlation coefficients between songs from T1+ and T2+ were not significantly different from the CCs obtained when cross-correlating song patterns within the T1+ period (T1xT1, blue bars). Columns in C represent the mean ± SEM and open circles indicate individual data points (NS, paired t-test, n = 6 animals). Source data for similarity calculations are available in the Figure 4—source data 1.

Figure 4—source data 1. Source file for song similarity calculations between subsequent testosterone treatments.
DOI: 10.7554/eLife.43194.015

Figure 4.

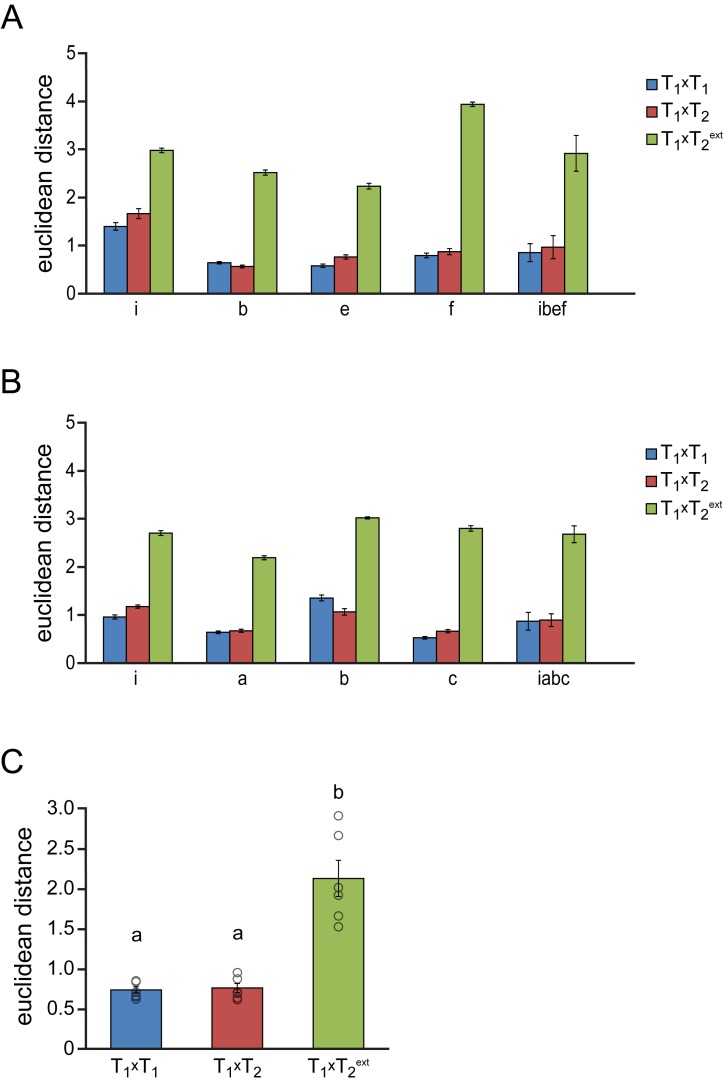
Figure 4—figure supplement 1. Syllable similarity during subsequent testosterone treatments.

Figure 4—figure supplement 1.

Euclidean distances are shown between syllables of the same type during a 1st testosterone treatment (T1xT1, blue bars), between syllables of the same type between the 1st and 2nd testosterone treatment (T1xT2, red bars), and between syllables of different types between the 1st and 2nd testosterone treatment (T1xT2ext, green bars). (A,B) Euclidean distances between individual song syllables and their means within and between testosterone treatments for the two birds shown in Figure 4. Lowercase letters correspond to the song phrases indicated in Figure 4A and B. (C) Group statistics demonstrating a strong similarity between syllables of the same type, but not between syllables of different types when comparing song syllables between the two testosterone treatments. Columns in A-C represent the mean ± SEM and open circles in C indicate individual data points (a,b: p<0.001, ANOVA, n = 6 animals).
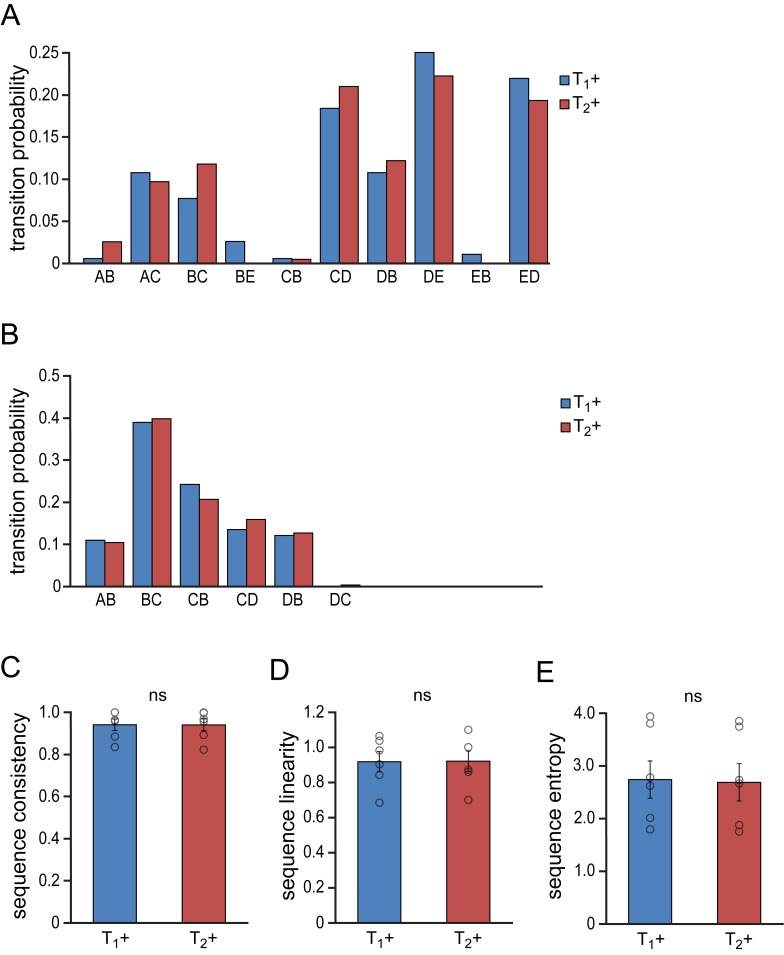
Figure 4—figure supplement 2. Similarity of song syntax during subsequent testosterone treatments.

Figure 4—figure supplement 2.

(A,B) Example probability distributions of song phrase transitions from two animals during the 1st (T1+, blue bars) and 2nd (T2+, red bars) testosterone treatment illustrating the strong similarity in phrase transitions between the two treatment periods. (C–E) Group statistics demonstrating stable consistency (C), linearity (D) and entropy (E) of phrase transitions during the two developmental phases. Columns in C-E represent the mean ± SEM and open circles indicate individual data points (NS, paired t-test, n = 6 animals).