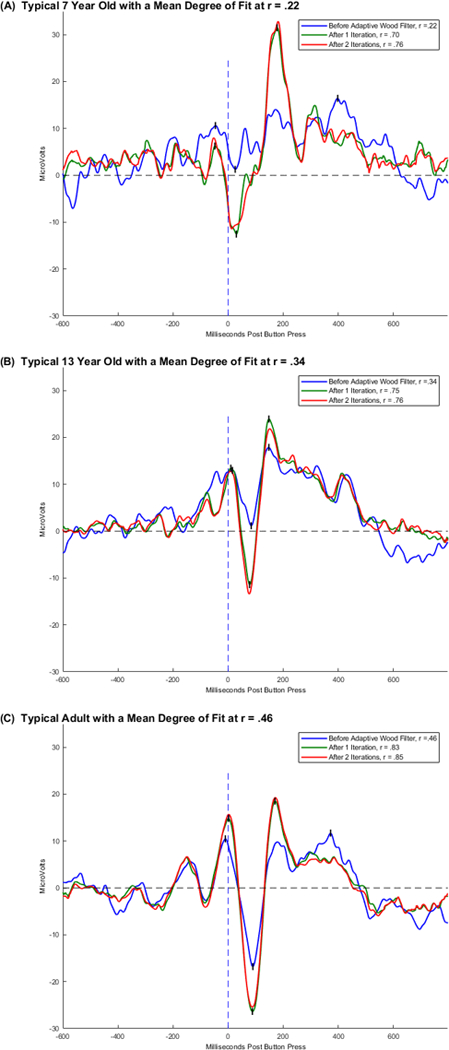
Figure 1.

Overlaid plots of averaged ERPs for three individuals who each represent the mean correlation coefficients of fit for their age group prior to use of the Adaptive Woody Filter. For each individual the blue plot represents the individual’s averaged ERP before latency variability correction of incorrect response segments time-locked to the button press (i.e., 0 ms). The green plot represents the same segments averaged after the 1st iteration of the Adaptive Woody Filter used to remove latency variability effects. The red plot represents the same segments averaged after the 2nd iteration of the Adaptive Woody Filter.
