Figure 2.

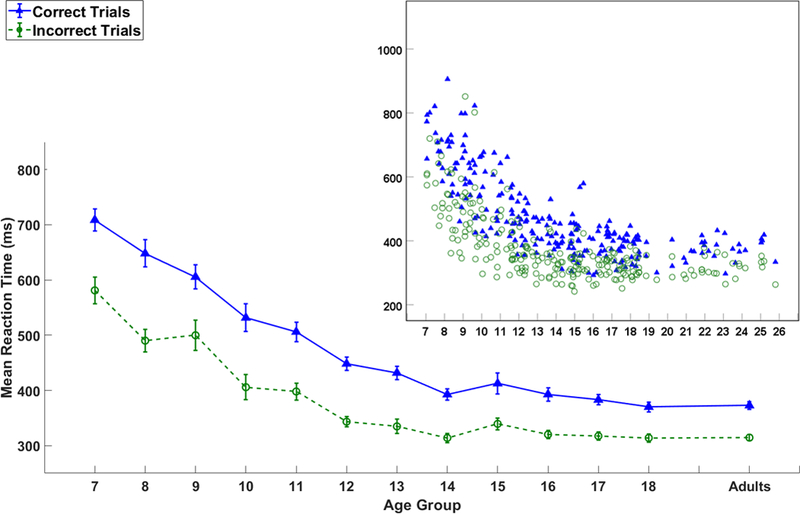
The line graph shows mean response time (ms) of correct and incorrect trials for each age group. Error bars represent +/− 1 standard error. The scatter plot insert shows the dispersion of response times by age as a continuous variable.

The line graph shows mean response time (ms) of correct and incorrect trials for each age group. Error bars represent +/− 1 standard error. The scatter plot insert shows the dispersion of response times by age as a continuous variable.