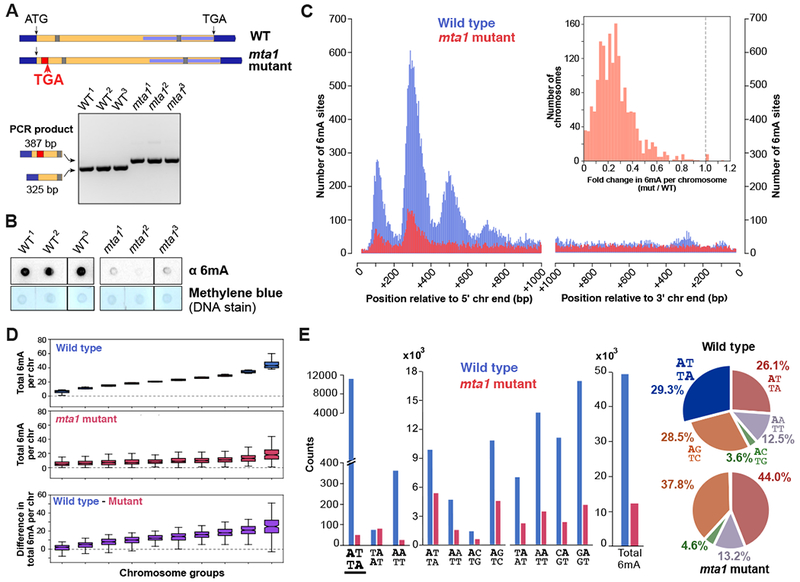
Figure 3. Genome-wide loss of 6mA in mta1 mutants.

(A) Schematic depicting the disruption of Oxytricha MTA1 open reading frame. Flanking dark blue bars: 5’ and 3’ UTR; yellow = open reading frame; red = retention of 62 bp ectopic DNA segment; grey bar = intron; internal light blue bar = annotated MT-A70 domain; “ATG” = start codon; “TGA” = stop codon. Agarose gel analysis shows PCR confirmation of ectopic DNA retention.
(B) Dot blot analysis of RNase-treated genomic DNA.
(C) Histogram of 6mA counts near 5’ and 3’ Oxytricha chromosome ends. Inset depicts histogram of fold change in total 6mA in each chromosome, between mutant and wild type cell lines.
(D) Chromosomes are sorted into 10 groups according to total 6mA in wild type cells (blue boxplots). For each group, the total 6mA per chromosome in mutants, and the difference in total 6mA per chromosome is plotted below. Boxplot features are as described in Figure 1C.
(E) Motif distribution in wild type and mta1 mutants. Loss of ApT dimethylated motif is underlined.
