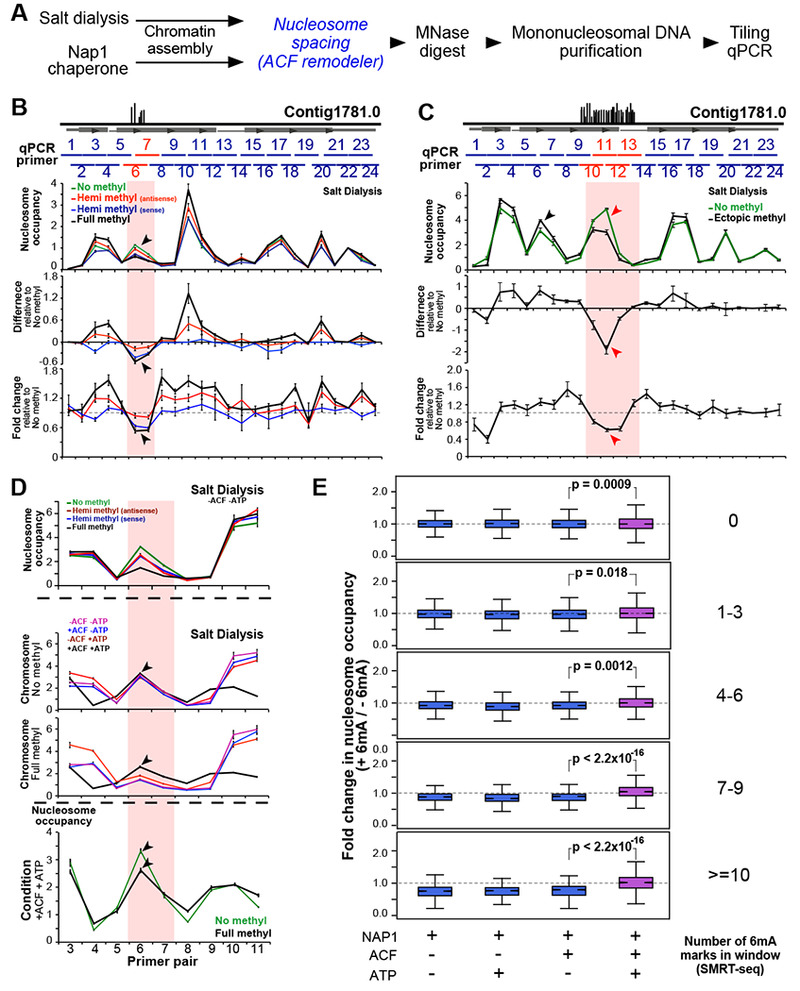
Figure 6. Quantitative modulation of nucleosome occupancy by 6mA.

(A) Experimental workflow. Chromatin is assembled using either salt dialysis or the NAP1 histone chaperone. Italicized blue steps are selectively included.
(B) Tiling qPCR analysis of synthetic chromosome with cognate 6mA sites. Horizontal grey box represents annotated gene, and vertical black lines depict native 6mA positions. Horizontal blue bars span ~100bp regions amplified by qPCR. Red horizontal lines represent the region containing 6mA. ‘Hemi methyl’ chromosomes contain 6mA on the antisense and sense strands, respectively, while the ‘Full methyl’ chromosome has 6mA on both strands. Black arrowheads: decrease in nucleosome occupancy specifically at the 6mA cluster.
(C) Tiling qPCR analysis of ectopically methylated synthetic chromosome. Vertical black lines illustrate possible 6mA sites installed enzymatically. Red arrowheads: decrease in nucleosome occupancy in the ectopically methylated region. Black arrowheads: position of cognate 6mA sites (not in this construct).
(D) Tiling qPCR analysis of chromatin from panel B that is subsequently incubated with ACF and/or ATP. ACF equalizes nucleosome occupancy between the 6mA cluster and flanking regions in the presence of ATP (black line). Nucleosome occupancy at the methylated region is not restored to the same level as the unmethylated control (black arrowheads).
(E) MNase-seq analysis of chromatin is assembled on native gDNA (“+” 6mA) and mini-genome DNA (“−“ 6mA) using NAP1 +/− ACF and ATP. P-values were calculated using a two-sample unequal variance t-test.
