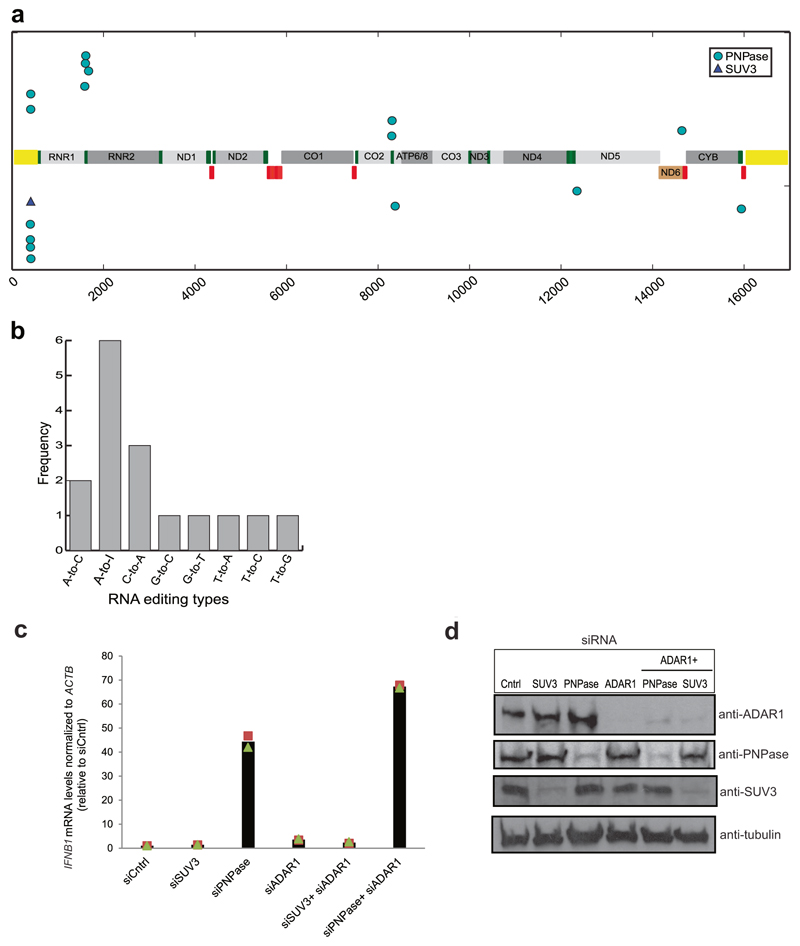
Extended Data Fig. 7. RNA editing of cytoplasmic mtRNA.
a, RNA editing sites mapped on the RNA transcriptome of SUV3 and PNPase depleted cells are shown. Each dot represents an editing event. Dots on the upper panel denote editing events on the H-strand and dots on the lower panel denote editing on the L-strand. Triangle denotes single SUV3 editing site. Yellow bars denote the D-loop region. Short red bars denote tRNA genes on the L-strand and green bars denote tRNA genes on the H-strand. b, Frequency of dinucleotide RNA editing sites mapped in the PNPase depleted samples. c, RT–qPCR analysis of IFNB1 mRNA levels in indicated siRNA-treated cells. Data are the mean from two independent experiments. d, Western blot of ADAR1, SUV3 and PNPase in cell treated with the indicated siRNAs. Blots are representative of two experiments. For gel source data, see Supplementary Fig. 1.

