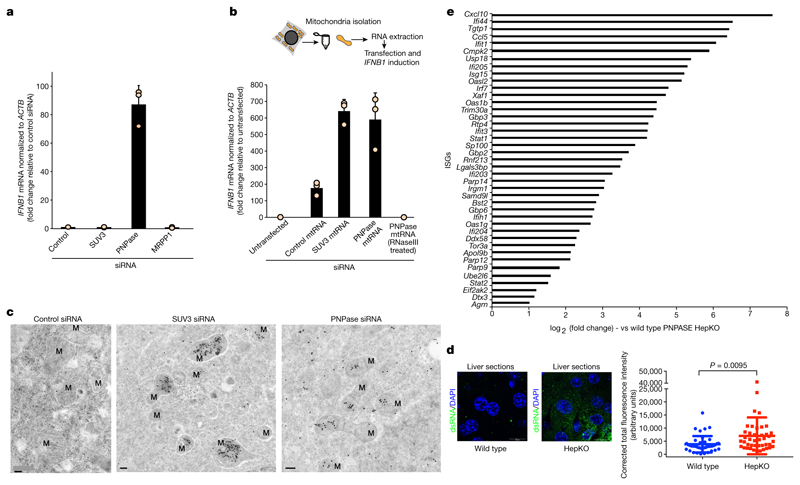
Fig. 2. PNPase suppresses a mtdsRNA-mediated type I interferon response.
a, RT–qPCR analysis of IFNB1 mRNA in HeLa cells treated with the indicated siRNAs. Data are mean ± s.d. from three independent experiments. b, Top, schematic of MACS strategy to purify mtRNA. Bottom, RT–qPCR analysis of IFNB1 mRNA in HeLa cells transfected with mtRNA (using MACS) as indicated. Data are mean ± s.d. from three independent experiments. c, Transmission electron microscopy images of immunogold labelled dsRNA (J2) in cryofixed HeLa cells treated with the indicated siRNAs. Images are representative of two experiments. M, mitochondria. Scale bars, 0.2 μm. d, Left, fluorescence immunohistochemistry staining of dsRNA (J2) in liver sections from wild-type and HepKO mice. Nuclei are stained with DAPI. Right, dsRNA quantification. Data are mean ± s.e.m. from 41 (wild-type) and 42 (HepKO) randomly sampled regions in two liver sections measured. The P value is from a two-sided unpaired t-test with Welch’s correction. e, log2 fold expression change of ISGs in wild-type versus HepKO mice. The ISG list is based on previously published work8.

