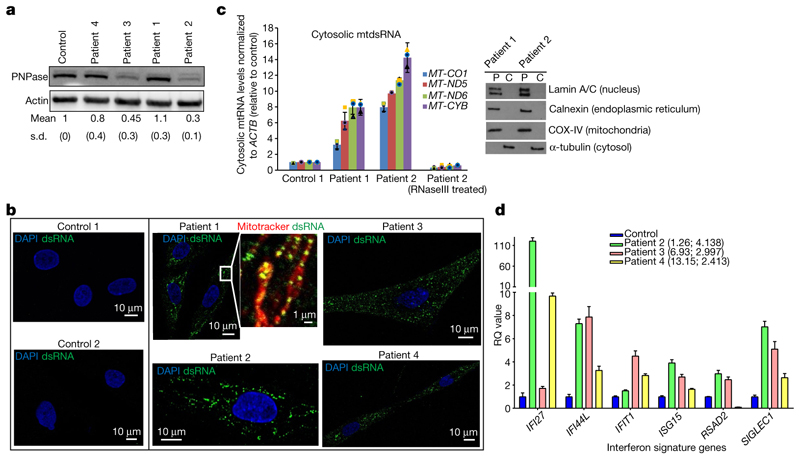
Fig. 3. Pathological PNPT1 mutations result in mtdsRNA accumulation and activation of ISGs.
a, PNPase western blot in fibroblasts from four patients with mutations in PNPT1 and a control. Quantification is shown as mean and s.d. from four experiments. b, Immunostaining of dsRNA (J2) in fibroblast cell lines from patients with PNPT1 mutations and controls. Mitochondria are stained with MitoTracker Red CMXRos and nuclei with DAPI (blue). Scale bars, 10 μm (main images) and 1 μm (expanded view). Images are representative of two experiments. c, Left, RT–qPCR analysis of cytosolic mtRNA (four loci) in cells with PNPT1 mutations versus control cells. Data are mean ± s.d. from three independent experiments. Right, fraction purity as shown by western blots. Blots are representative of two experiments. P, pellet; C, cytosolic fractions. d, RT–qPCR analysis of six ISGs in whole blood from patients 2, 3 and 4. Ages when tested in decimalized years and interferon score are shown in brackets. The data plotted is relative quantification (RQ) values for each patient, with the error bars representing RQmin and RQmax. Data are from combined 29 control samples (blue bar) and 3 individual patient samples measured in triplicate. For gel source data, see Supplementary Fig. 1.

