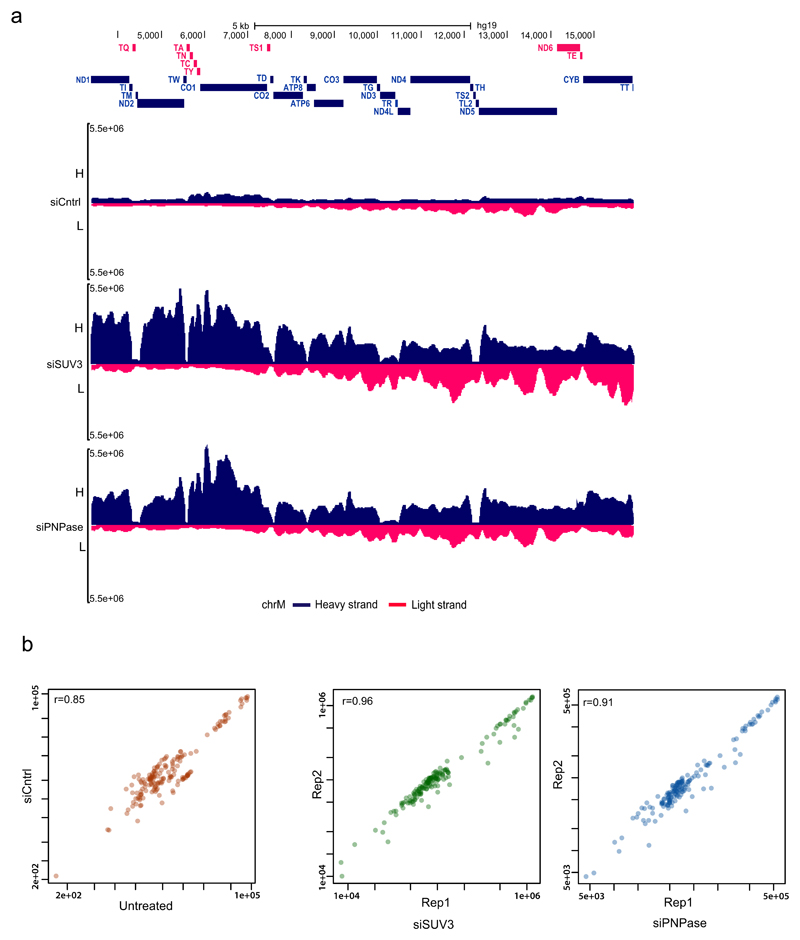
Extended Data Fig. 5. dsRNA-seq of HeLa cells following siRNA depletion of SUV3 and PNPase.
a, dsRNA-seq reads across the mitochondrial genome spanning entire protein coding region (~3.5–16 kb) following siRNA treatment. Data are from two independent experiments. H-strand genes are shown as blue bars and L-strand as red bars. Short tRNA genes are denoted with T as the first letter. b, Correlation plots of J2 immunoprecipitation dsRNA-seq replicates. Pearson correlation coefficients are calculated and shown on each plot.

