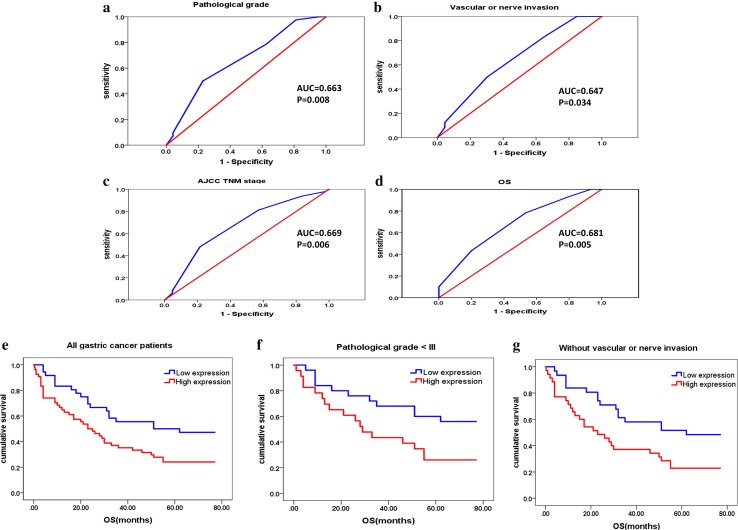
Fig. 5.
ROC curve analysis and Kaplan–Meier (K–M) analysis for CTD-2510F5.4 expression in the gastric cancers. CTD-2510F5.4 expression could be significantly distinguished by clinicopathological parameters of pathological grade (a), vascular or nerve invasion (b), AJCC TNM stage (c) and OS (d). K–M plots showed the correlations between CTD-2510F5.4 expression and the OS of d all gastric cancer patients, e gastric cancer patients at pathological grade < III, f gastric cancer patients without vascular or nerve invasion. K–M plots were shown for both median survival time (MST) and median OS

