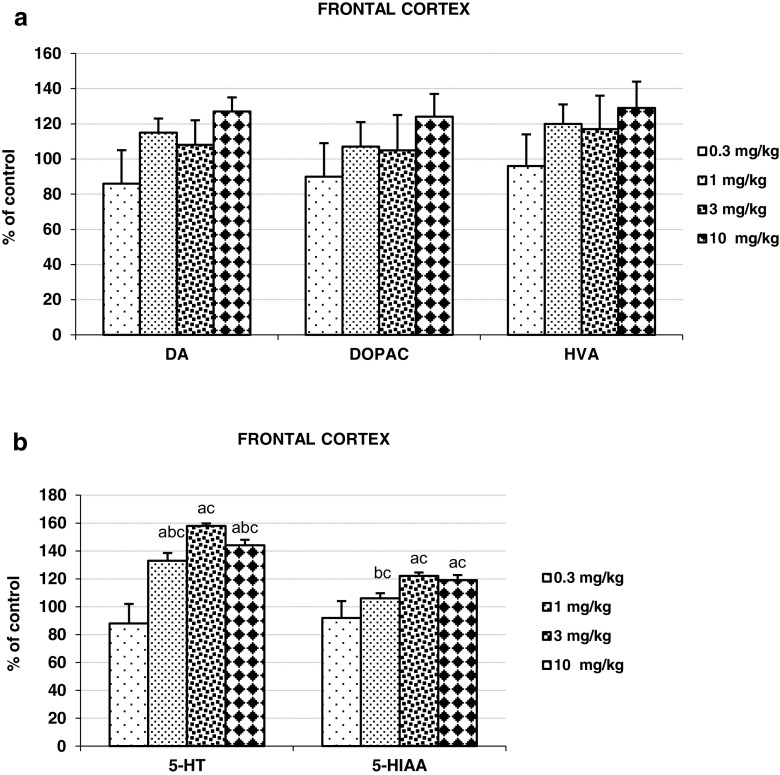
Fig. 3.
The effects of 25I-NBOMe on tissue contents of DA, DOPAC, HVA, 5-HT, and 5-HIAA in the rat frontal cortex measured 45 min after administration of the drug. Panels a and b show each percent change in comparison to control group and calculated from the absolute numbers given in nanograms/milligrams of tissue presented in supplementary materials. Values are the mean ± standard error of the mean (SEM) (n = 6 per experimental groups). “a” P < 0.01 vs. control group; “b” and “c” P < 0.01 show significant difference vs. 3 and 0.3 mg/kg 25I-NBOMe, respectively (one-way ANOVA and Tukey’s post hoc test)

