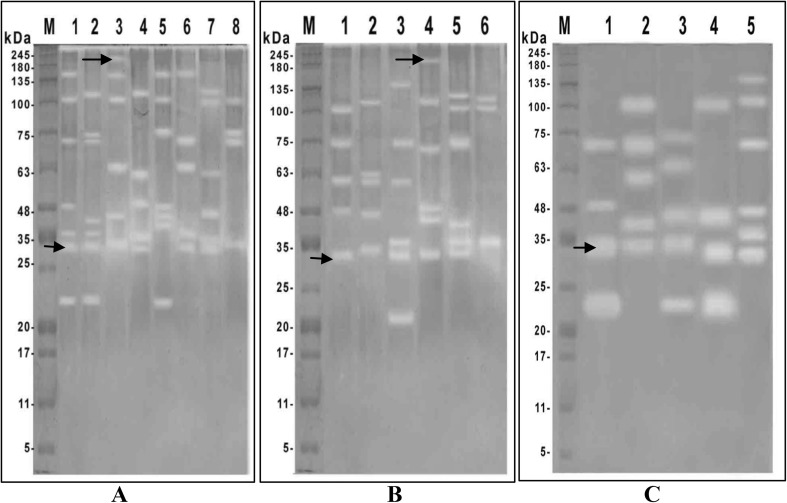
Fig. 3.
Gelatin-SDS–PAGE showing the protease profiles of different Blastocystis isolates. Protease bands can be seen as clear bands against blue background. Lanes 1–4 in a, lanes 3–5 in b represent isolates in GI (CRC group). Lanes 5–7 in a, lanes 1–2 in b and lane 5 in c represent isolates in GII (Non-CRC symptomatic group). Lane 8 in a, lane 6 in b and lanes 1–4 in c represent isolates in GIII (Non-CRC asymptomatic group) (color figure online)

