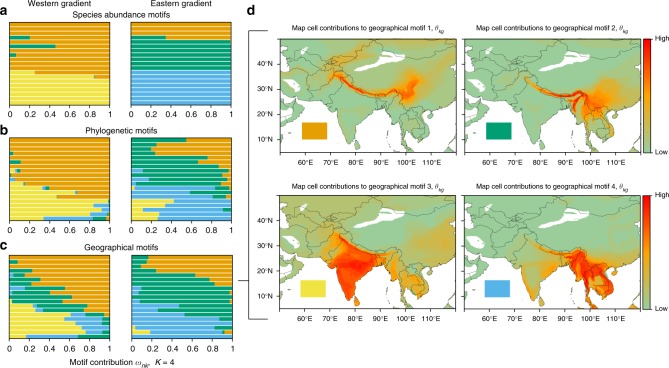
Fig. 3.
Motif contributions to local communities when K = 4. Communities arranged by elevation within geographical regions, as in Fig. 2a. a Species abundance motif contributions to local communities. b Phylogenetic motifs for clades subtended by the 20 million-year timeline (n = 67 clades, Supplementary Fig. 10). c Geographical motif contributions to local communities. d Maps show map cell contributions to the geographical motifs (θkg), with colour intensity relative to the value of θkg

