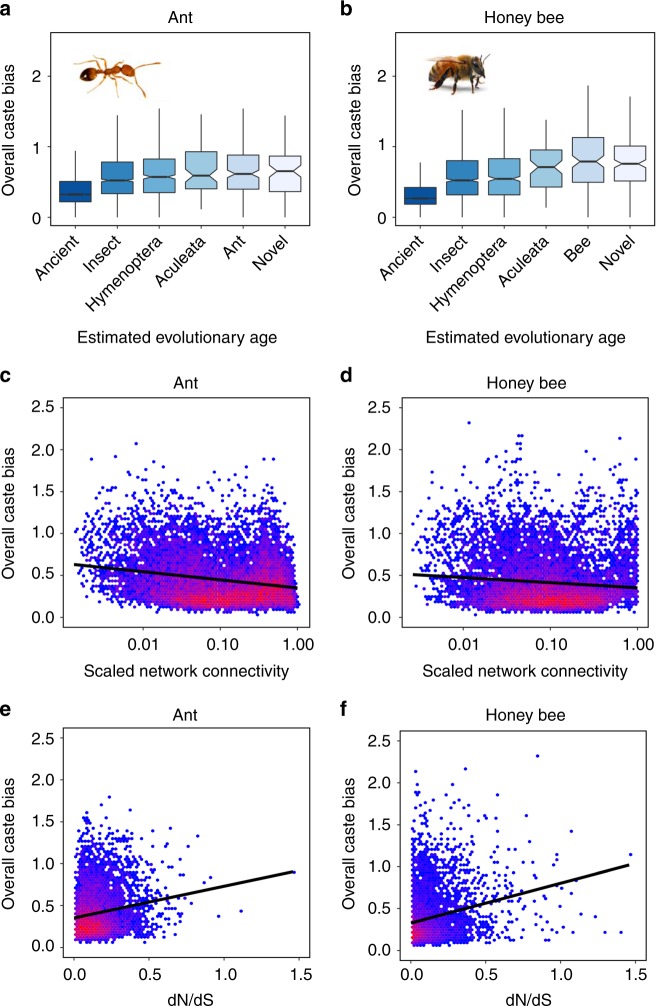
Fig. 4.
Evolutionary and network features of caste-biased genes. Genes that exhibit more caste bias across tissues and developmental stages have younger estimated evolutionary ages (a, b) and tend to be loosely connected (c, d; Spearman correlation; ant: rho = −0.159, P < 0.001; honey bee: rho = −0.090, P < 0.001) and rapidly evolving (e, f; Spearman correlation; ant: rho = 0.157, P < 0.001; honey bee: rho = 0.240, P < 0.001). Overall caste bias combines queen/worker log2 fold-change values across all development stages and adult body segments. Connectivity is calculated using all samples and genes and scaled proportionally to the highest value. In a and b, middle line represents median values, outer edges of boxplot represent upper and lower quartiles, and whiskers represent a deviation of 1.5*(interquartile range) from the upper and lower quartiles. Source data are provided as a Source Data file. Photos were taken by Luigi Pontieri (pharaoh ant) and Alex Wild (honey bee)

