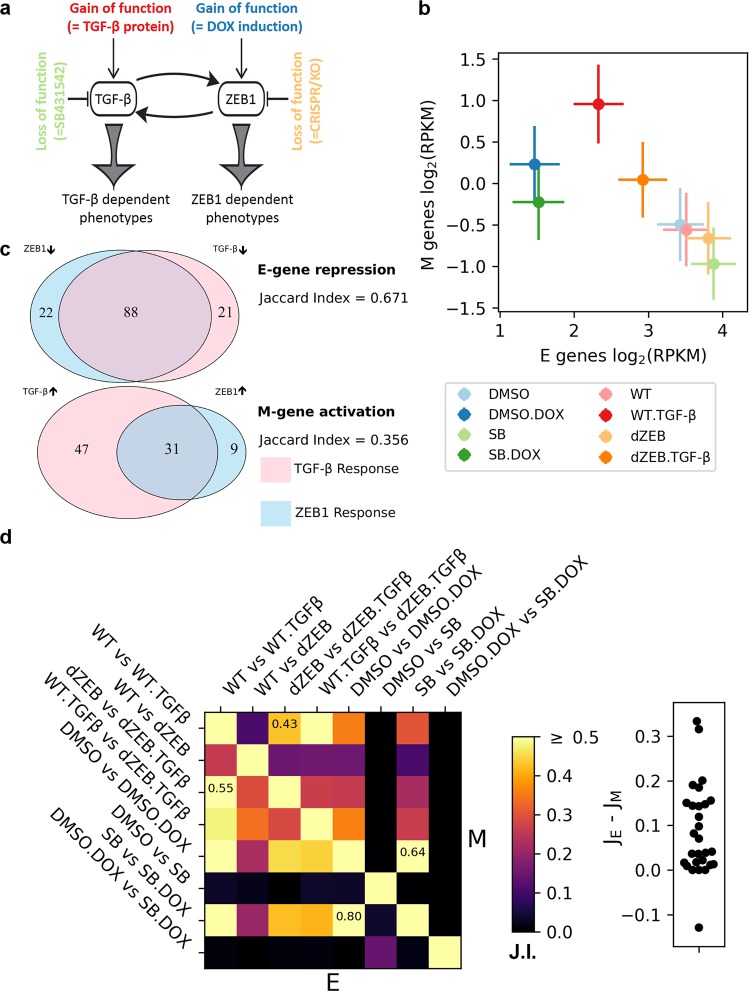
Fig. 1.
Quantification of EMT gene expression in response to TGF-β and ZEB1. a Illustration of perturbations of TGF-β and ZEB1 conditions in this study. Each colored perturbation has a control condition. b Mean expression levels of E-genes and M-genes of eight conditions. Vertical and horizontal bars show standard error of the means for all annotated E or M genes. The colors are matched to a. c Venn diagrams showing the overlap in E (top) and M (bottom) genes, which show significant expression differences in response to TGF-β or ZEB1 treatment relative to their respective control conditions. TGF-β response is in pink while ZEB1 response is in light blue. The number E-genes and M-genes responding to TGF-β or ZEB1 uniquely, as well as those responding to both are listed in the respective part of the Venn diagram. The type of response, activation, or repression, is indicated by directional arrows (up-arrow: activation, down-arrow: repression). The overlap was quantified using the Jaccard index, which is the number of genes differentially expressed by both TGF-β and ZEB1 divided by the total number of differentially expressed genes. d Jaccard indices of E-genes and M-genes for each pair of conditions. Heatmap shows all the Jaccard indices. Lower triangular entries: E-genes. Upper triangular entries: M genes. The Jaccard index for the conditions which differ most between E-genes and M-genes are shown in those cells. Swarm plot shows the differences between the Jaccard indices of E-genes and those of the M-genes for each of the 28 pairs of conditions (p < 0.001 for single value t-test with a null distribution centered at 0)

