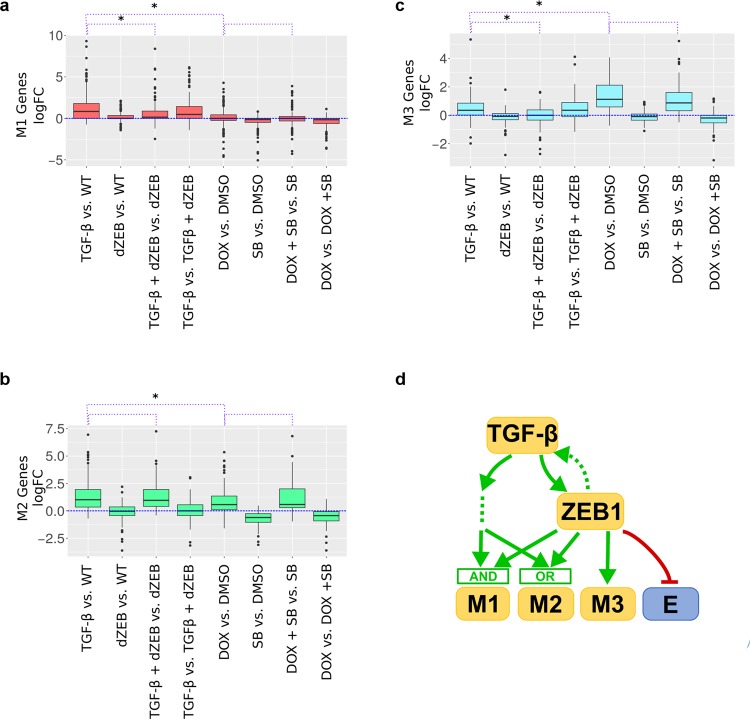
Fig. 3.
Expression of M-gene clusters under TGF-β and ZEB1 regulation. a Boxplot of log fold-change of expression of M1 genes in the eight contrast conditions (see Table 2). The colored region (red) indicates the inter-quartile range of expression while whiskers extend 1.5 times this range on either side. Outliers are indicated by black dots. The purple dotted lines above the plot indicate comparisons between the expression under conditions, specifically, TGF-β vs. WT to DOX vs. DMSO, TGF-β vs. WT to TGF-β+dZEB vs. dZEB and DOX vs. DMSO to DOX+SB vs. SB. A * indicates that distribution of expression is significantly different based on the Mann–Whitney U-test at an alpha of 0.05. b Similar to a but for M2 genes, with a green colored region. c Similar to a, but for M3 genes, with a blue colored region. d A model of EMT-gene regulation based on the expression patterns of M-genes clusters in a–c. Green arrows indicate activation while red arrows indicate repression

