Fig. 5.
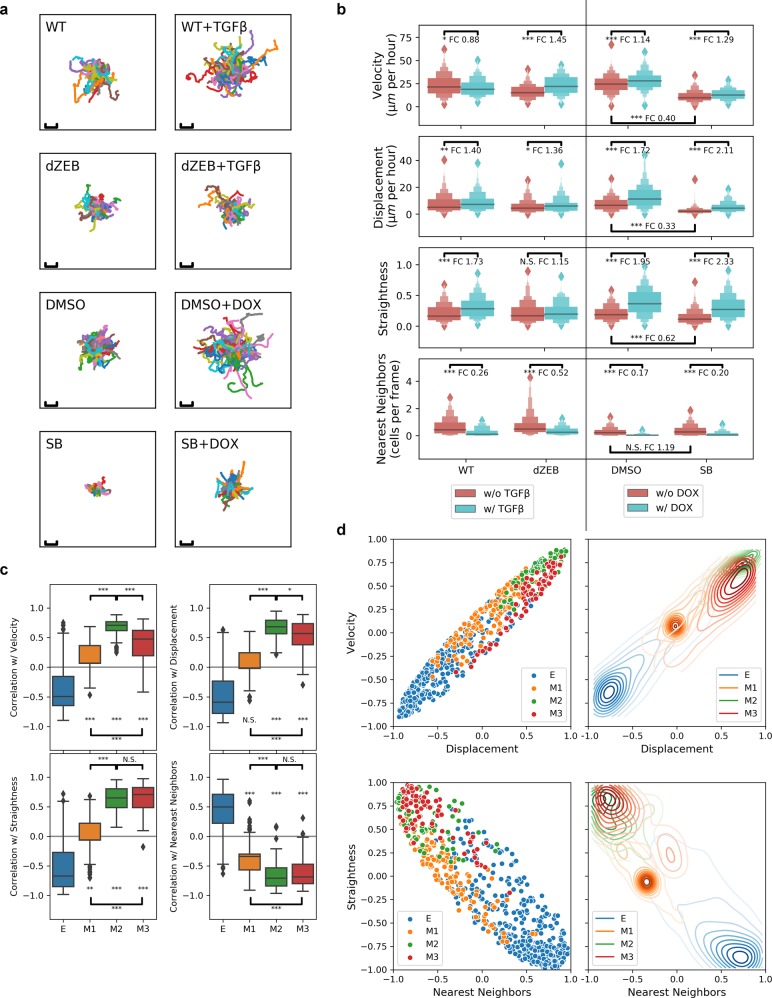
Differential cell movement patterns regulated by ZEB1-dependent and ZEB1-independent pathways. a Cell movement trajectories when TGF-β signaling and/or ZEB1 expression is perturbed under eight conditions. Hundred cells were randomly selected for each condition. Each trajectory was centered at its starting position. Scale bar represents a length of 100 μm. b Distributions of four metrics (instantaneous velocity, mean displacement normalized by duration of trajectory, straightness index of the movement, and number of nearest neighbors) shown in letter-value plots for cell trajectories under eight conditions. Statistical significance was obtained using Mann–Whitney U-test. FC fold-change. c Distributions of Spearman correlations coefficients (as a distance measurement) between gene expression and movement metrics for four type of genes (E, M1, M2, and M3) across eight conditions. The colored region indicates the inter-quartile range of expression while whiskers extend 1.5 times this range on either side. Outliers are indicated by black dots. d Scatter plots showing pairwise relationships between correlation coefficients of gene expression and different movement metrics. ***p < 0.001, **p < 0.01, *p < 0.05, N.S.: not significant (p > 0.05), t-test. Significant mark at each box indicates the p value for testing if the mean of the group is significantly different from 0. Significant mark at each horizontal bar indicates the p value for testing if two groups of values are significantly different

