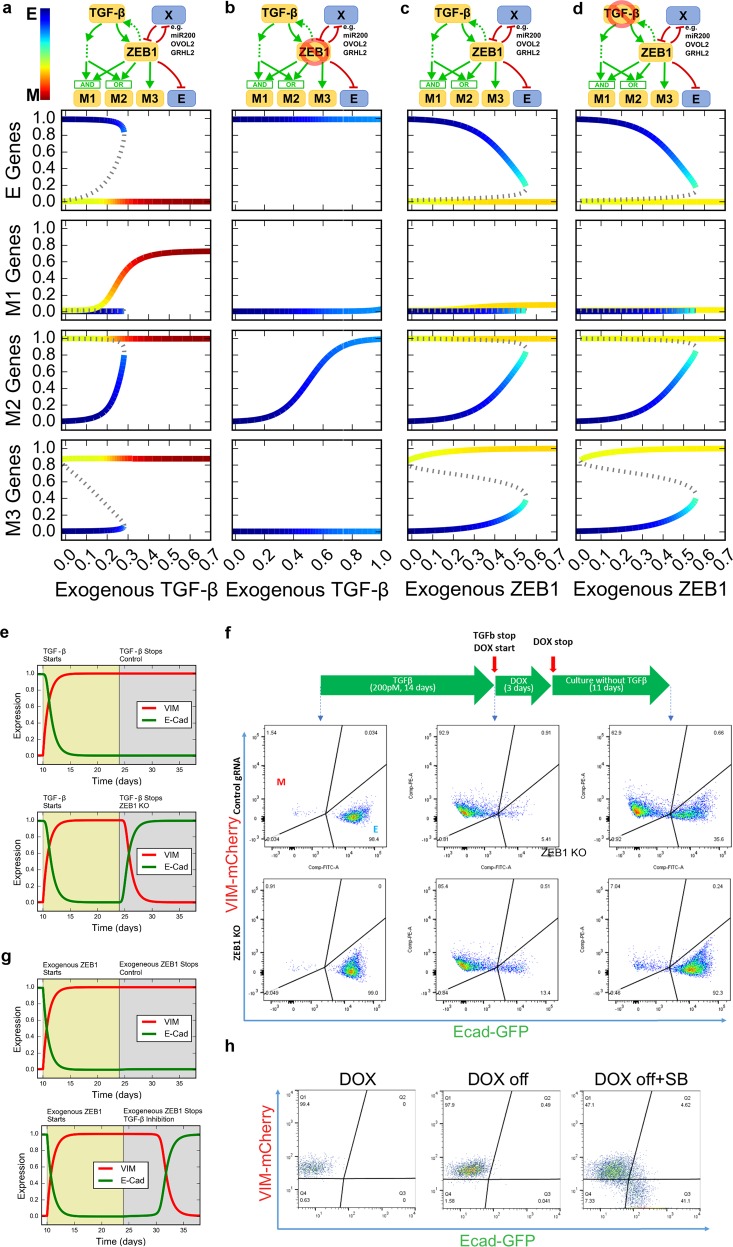
Fig. 6.
Mathematical modeling of EMT under control of TGF-β and ZEB1. a–d Top diagrams: influence diagrams for gene regulatory networks under four conditions. Lower panels: bifurcation diagram for four types of genes (E, M1, M2, and M3) with respect to exogenous TGF-β and ZEB1 expression under two conditions. Solid curves represent stable steady states. Dashed curves represent unstable steady states. Color gradient represents the position in the EMT spectrum, which is calculated by adding the expression of the three M nodes and subtracting the expression of the E node. a Normal condition. Induced by TGF-β. b ZEB1 KO. Induced by TGF-β. c Normal condition. Induced by ZEB1. d TGF-β-inhibited condition. Induced by ZEB1. e Simulation for expression of VIM and E-cad upon treatment and withdrawal of TGF-β. Top: control. Bottom: ZEB1 KO after TGF-β withdrawal. f Expression of VIM and E-cad analyzed by FACS upon treatment and withdrawal of TGF-β. Top: control. Bottom: ZEB1 knockout induced by DOX. Cells were treated with TGF-β for 2 weeks and then subject to TGF-β withdrawal, and (for the experiment group) to ZEB1 knockout. g Simulations for expression of VIM and E-cad upon treatment and withdrawal of exogenous ZEB1 expression followed by inhibition of TGF-β signaling. h Expression of VIM and E-cad analyzed by FACS upon induction and withdrawal of exogenous ZEB1 by DOX. Exogenous ZEB1 was induced for 1 week and then subject to the withdrawal of the induction signal for 2 weeks, and (for the experiment group) to the inhibition of TGF-β signal by SB431542 (SB) for the same period

