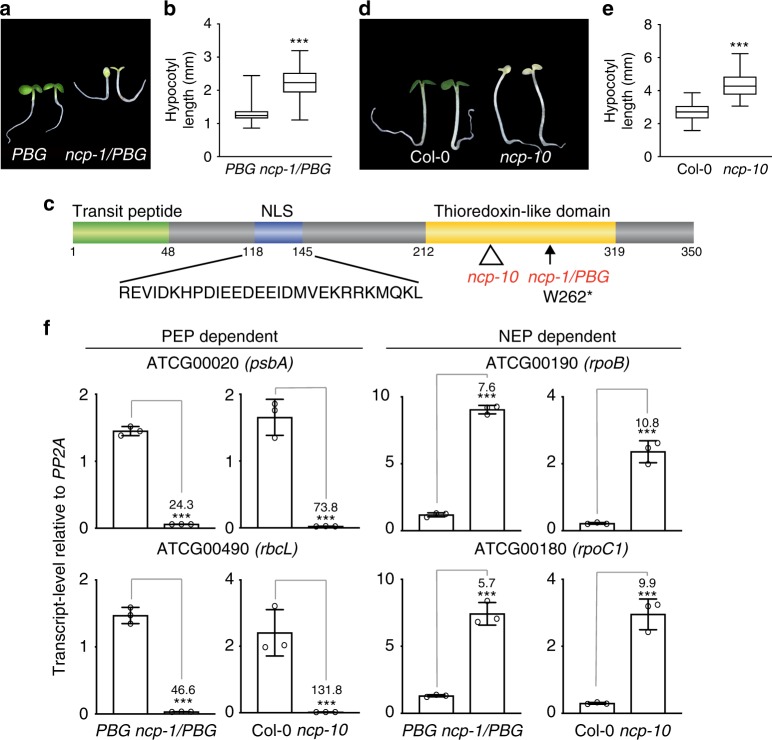
Fig. 1.
Identification of NCP by a screen for tall-and-albino mutants. a Representative images of 4-day-old PBG and ncp-1/PBG seedlings grown in 10 μmol m−2 s−1 continuous R light. b Box-and-whisker plots showing hypocotyl measurements of the seedlings in a. c Schematic illustration of the predicted domain structure of NCP. The mutation in ncp-1/PBG and the T-DNA insertion site in ncp-10 are indicated. NLS, nuclear localization signal. d Representative images of 4-day-old Col-0 and ncp-10 seedlings grown in 10 μmol m−2 s−1 continuous R light. e Box-and-whisker plots showing hypocotyl measurements of the seedlings in d. f qRT-PCR results showing the steady-state mRNA levels of the PEP-dependent psbA and rbcL and the NEP-dependent rpoB and rpoC1 in 4-day-old PBG, ncp-1/PBG, Col-0, and ncp-10 seedlings grown in 10 μmol m−2 s−1 continuous R light. Error bars represent SD of three biological replicates. The transcript levels were calculated relative to those of PP2A. The numbers above the right columns are the fold changes in gene expression between the columns. For the box-and-whisker plots in b and e, the boxes represent from the 25th to the 75th percentiles, and the bars equal the median values. For b, e, and f, asterisks (***) indicate a statistically significant difference between the values of the mutants and those of the wild-type or the parental line (Student’s t-test, p ≤ 0.001). The source data of the hypocotyl measurements in b, e and the qRT-PCR data in f are provided in the Source Data file

