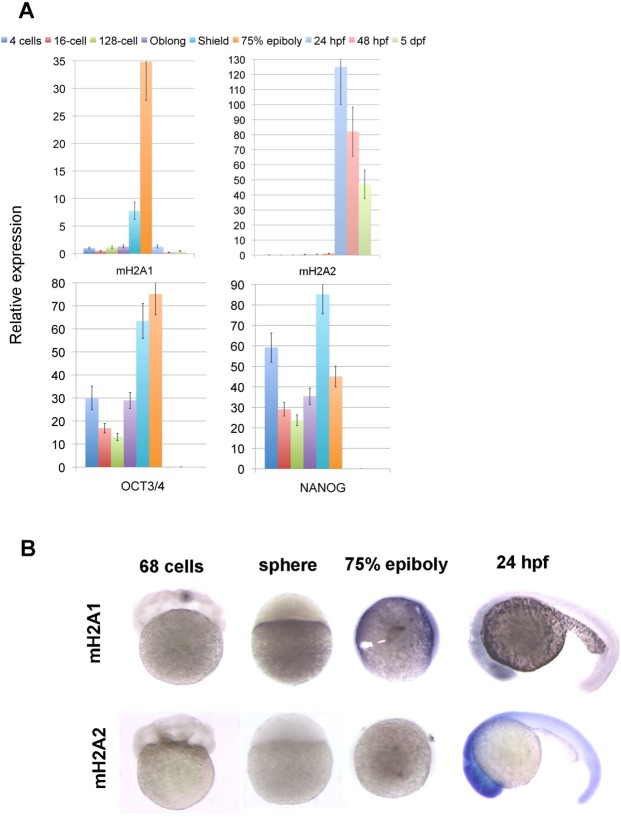
Figure 1.
Zebrafish mH2A expression pattern during early embryo development. Wild type zebrafish embryos were collected at different developmental stages. (A) Quantitative RT-PCR was performed for mH2A1, mH2A2 and two genes characteristic of undifferentiated stage (OCT4 and NANOG). Mean values (n = 3) ± SEM are plotted. Values indicate relative expression of the specific gene normalized to GAPDH/TUBULIN. (B) Whole-mount RNA in situ hybridization using mH2A1 and mH2A2 specific probes showing different temporal and spatial gene expression pattern (n = 50–60 embryos/probe with identical labeling).

