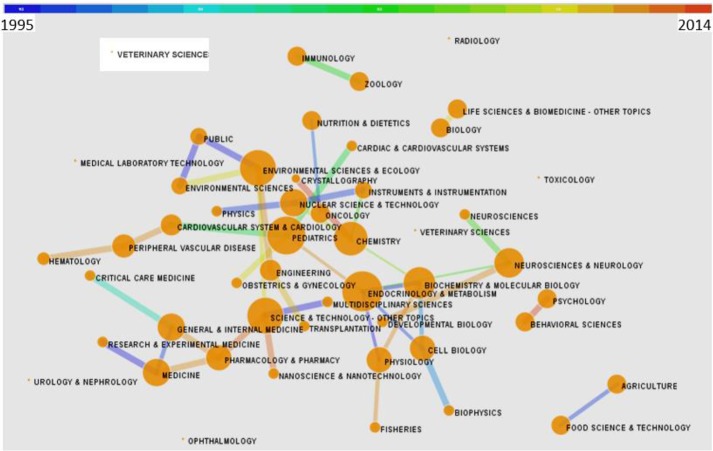
Fig. 4:
Distribution of interrelation of subject categories for papers on “selenium effect on thyroid disorders.” Dot size is proportional to the betweenness centrality. Lines between subjects indicate a relationship between those subjects and the thickness of the line indicate the strength of the link. The color of the line indicates the year in which the two related subjects frequently appeared in the same articles (see color key at top of figure)

