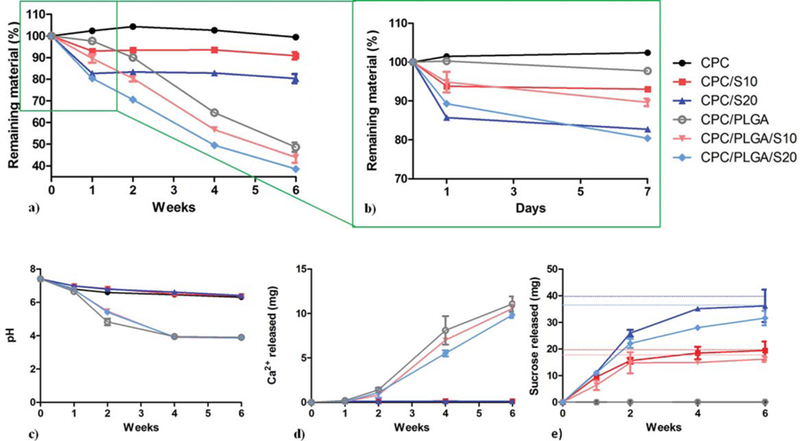
FIGURE 2.

Degradation of CPC composites. (a) Mass loss of each groups represented by the remaining material as a function of degradation time and (b) magnification of the mass loss in week 1. (c) pH, (d) cumulative calcium release and (e) cumulative sucrose release and maximum theoretical release of each cement formulation to the surrounding PBS. Error bars represent SD.
