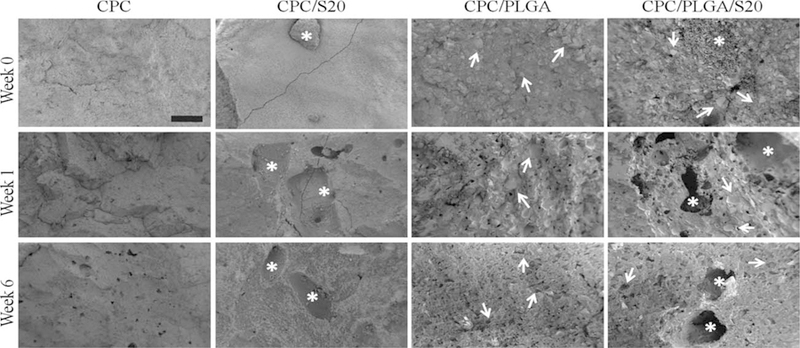
FIGURE 3.

Representative SEM images of CPC, CPC/S20, CPC/PLGA, and CPC/PLGA/S20 formulations before incubation (week 0), after 1 week incubation and after 6 weeks incubation. Black bar represents 200 μm. Long yellow arrows indicate either presence of sucrose or sucrose-related porosity. Short red arrows indicate either the presence of PLGA or PLGA-related porosity.
