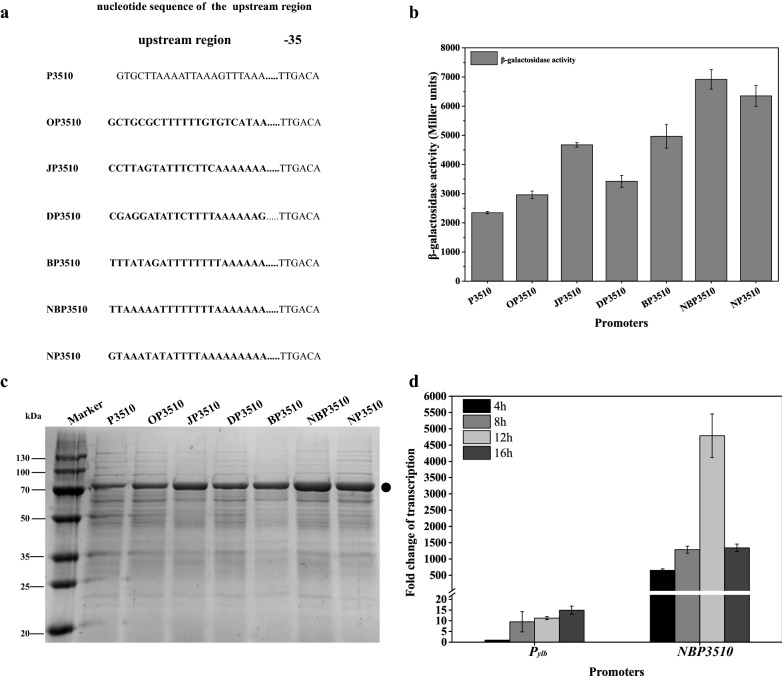
Fig. 3.
Optimization of the upstream region of the P3510 promoter. a the upstream regions of the P3510 promoter were changed to corresponding sequence. The nucleotides in bold italic indicate mutated sequences. b The BgaB expression level under the control of P3510 derivatives. c SDS-PAGE analysis of the BgaB expression. Equal amounts (30 μg) of total protein were loaded into each lane. The band corresponding to BgaB was marked. d Comparative analysis of the transcription levels of two promoters at different time points. The transcription level of Pylb promoter at the time point 4 h was set as 1. The reference gene was 16 s rRNA. All cultures were grown in triplicate, and each experiment was performed at least twice. Error bars indicate standard deviations

