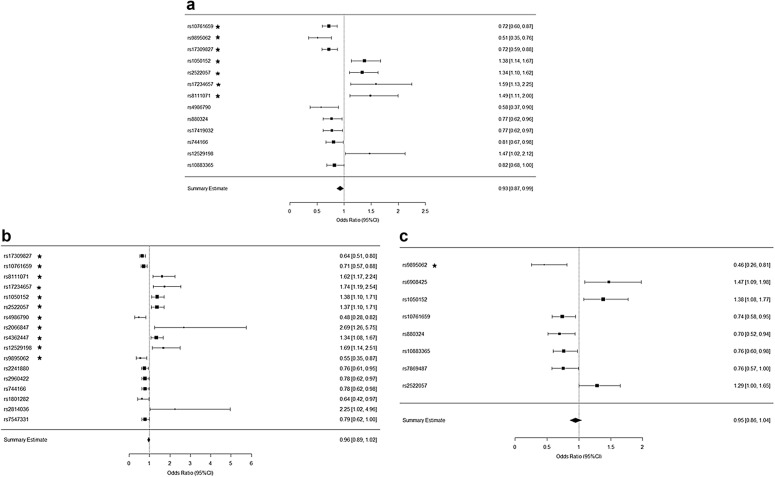
Fig. 2.
Forest plots of OR ratios for the SNPs highlighted by the SNP analysis performed via plink. These refer to a IBD vs HC, b CD vs HC, and c UC vs HC. All the depicted SNPs statistically significantly relative to the corresponding disease phenotype (p value < 0.05 and the ones with the star have a p-value < 0.01). Furthermore, results with an OR score < 1 point to a disease association where the SNP is a homozygote with the minor allele and an OR score > 1 points to a heterozygote

