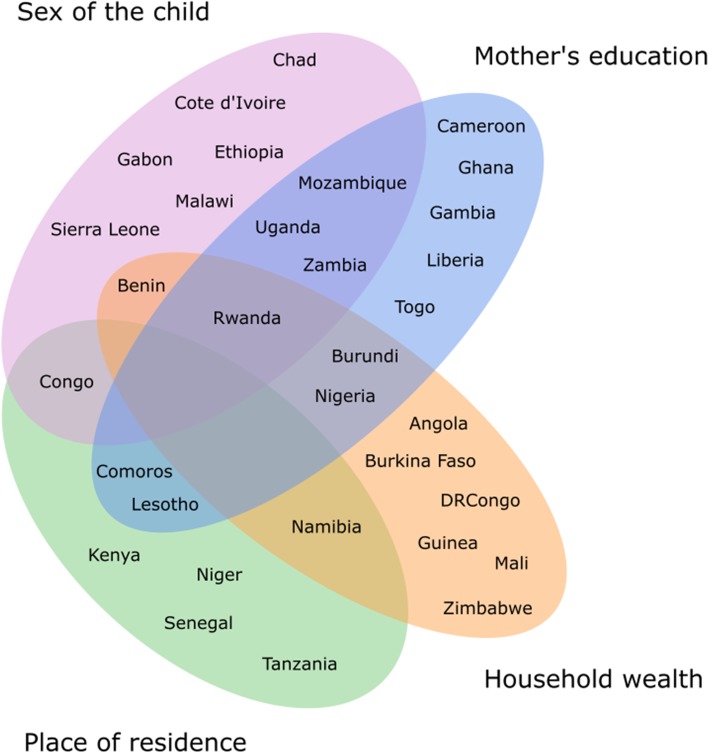
Fig. 2.
Classification of the 32 countries according to the main contributors to the variability in U5MR. A factor was defined as a main contributor if its contribution to the variability in U5MR exceeded 25% according to the regression-based decomposition of the Gini index (Table 2). The Venn diagram was developed using the R function “venn.diagram”

