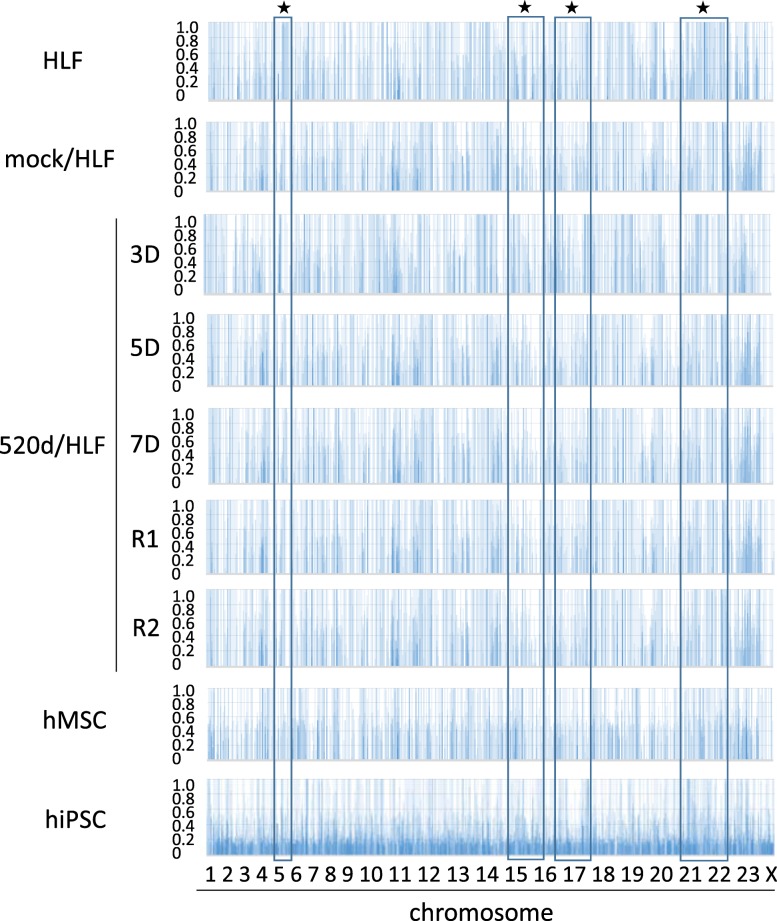
Fig. 1.
A frequency of allele changes per chromosome is shown. Mutation analysis in HLF, mock/HLF, 3D, 5D, 7D, R1, R2, hMSC, hiPSC by NGS. This area graph showed that the total number of mutations were getting reduced in HLF derivatives regarding a frequency of allele changes per chromosome. ★ indicates the representative sites in Fig. 3

