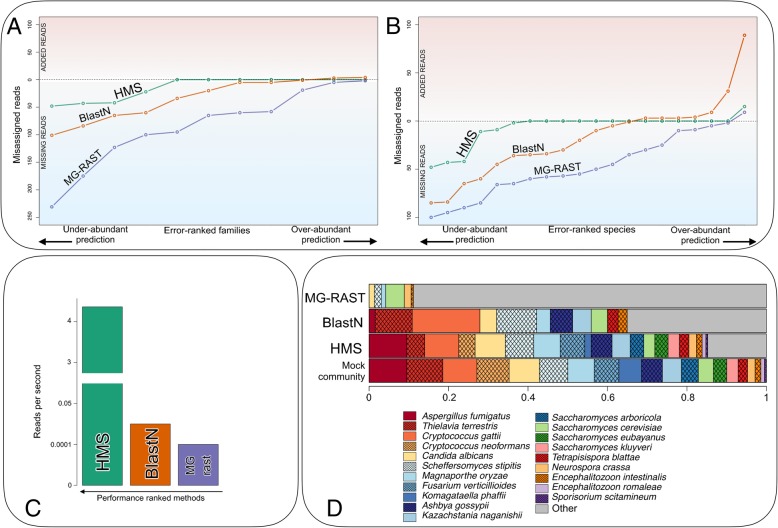
Fig. 2.
Comparison of HumanMycobiomeScan with other existing assignment methods. Five synthetic fungal communities were used to compare HumanMycobiomeScan (HMS) with BlastN [32] and MG-RAST [33]. The actual number of misassigned reads, including those under- or over-assigned, is reported at family (a) and species (b) level. The horizontal line in the plots represents the “expected” value, meaning that all reads for a specific taxon were assigned to the correct reference genome. Points below or above the line indicate a lower or higher number of reads assigned to a specific taxon compared to the expected value. c The number of reads processed per second working on a single CPU is shown. d A comparison between the actual relative abundances of a mock community taken as an example and those reconstructed using the various methods of analysis was carried out. The gray portion represents the fraction of misassigned reads

