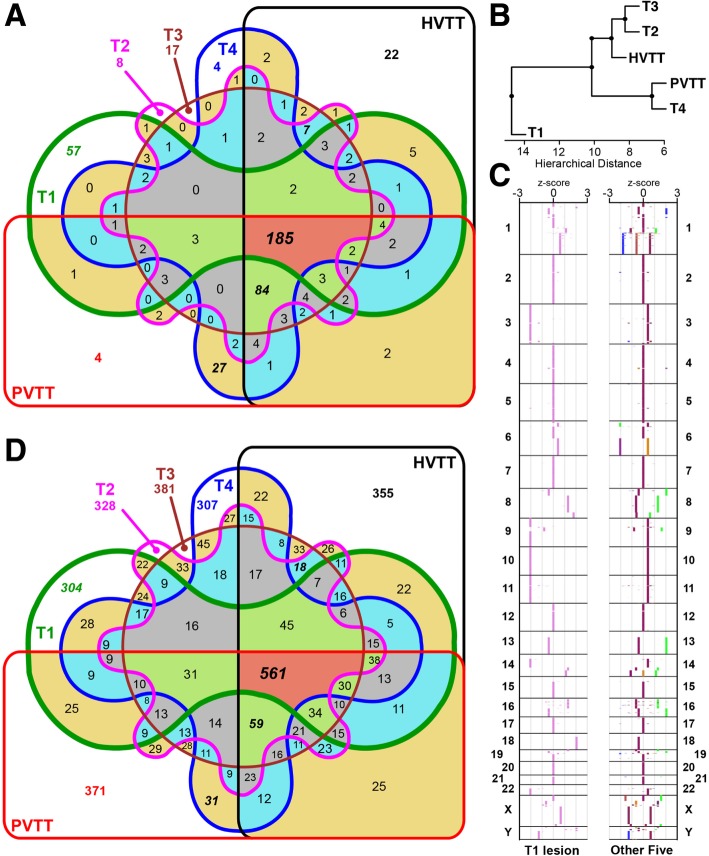
Fig. 4.
Comparison of genome-wide somatic alterations among six tumors. a Venn diagram comparing the somatic SNVs in genetic region among the six tumors. b Hierarchical clustering based on genetic somatic SNVs. c Distribution of copy number z-score along the genome of T1 and the other five tumor tissues. d Venn diagram comparing the somatic SVs among the six tumors

