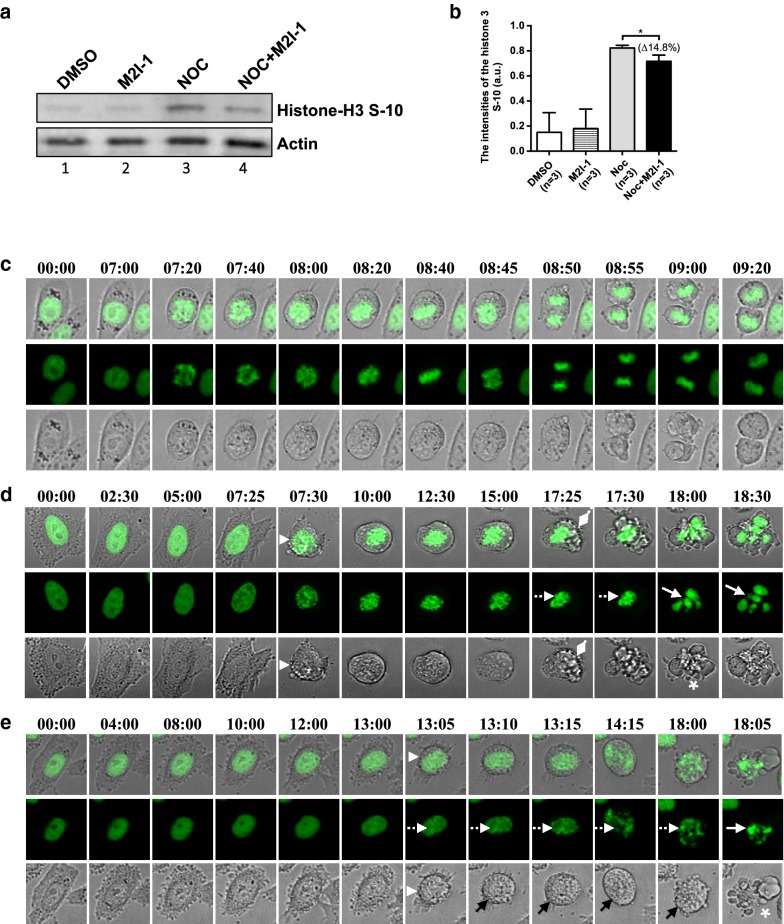
Fig. 2.
The majority of cell deaths occurred after prolonged mitotic arrest. a Cell extracts were prepared from HeLa cells after 16 h of the different drug treatments as described previously. The western blot membranes were probed with a rabbit polyclonal anti-phospho-histone H3 (S-10) antibody (Millipore, #06-570) (1:500 dilutions), and the actin protein bands acted as the loading control. b Quantitative comparison of the phospho-histone 3 S-10 bands. Results produced from three independent experiments. c The confocal time-lapse images showing an example of a normal/unperturbed HeLa H2B-GFP cell undergoing the cell cycle in mitosis. d An example of a HeLa H2B-GFP cell undergoing apoptosis after prolonged mitotic arrest by 60 ng/ml nocodazole or 60 ng/ml nocodazole + 50 μM M2I-1. The white arrowhead indicates the time point when the cytoplasmic membrane (DIC grey images) of the cell starts shrinking and rounding up with condensed chromosomes (green). The diamond heads indicate the time point that the cytoplasmic membrane began blebbing. The chromosomes displaying fragmentation and over-condensation are highlighted by white dashed arrows and normal arrows respectively. A typical apoptotic-body like morphology is highlighted with the asterisk. e An example of a HeLa H2B-GFP cell undergoing apoptosis at a prophase-like stage induced by treatment with 60 ng/ml nocodazole + 50 μM M2I-1. The white arrowhead highlights the time point where there is clear cell body shrinkage, dash arrows highlight the fragmenting chromosomes and normal black arrows indicate the intact cytoplasmic membrane during chromosome fragmentation. Asterisks highlight the formation of a typical apoptotic-body like morphology. The green histone 2B-GFP highlights the chromosomal morphologies and the DIC images in grey indicate the cellular boundaries and the cytoplasmic membrane. The timing of the images is indicated

