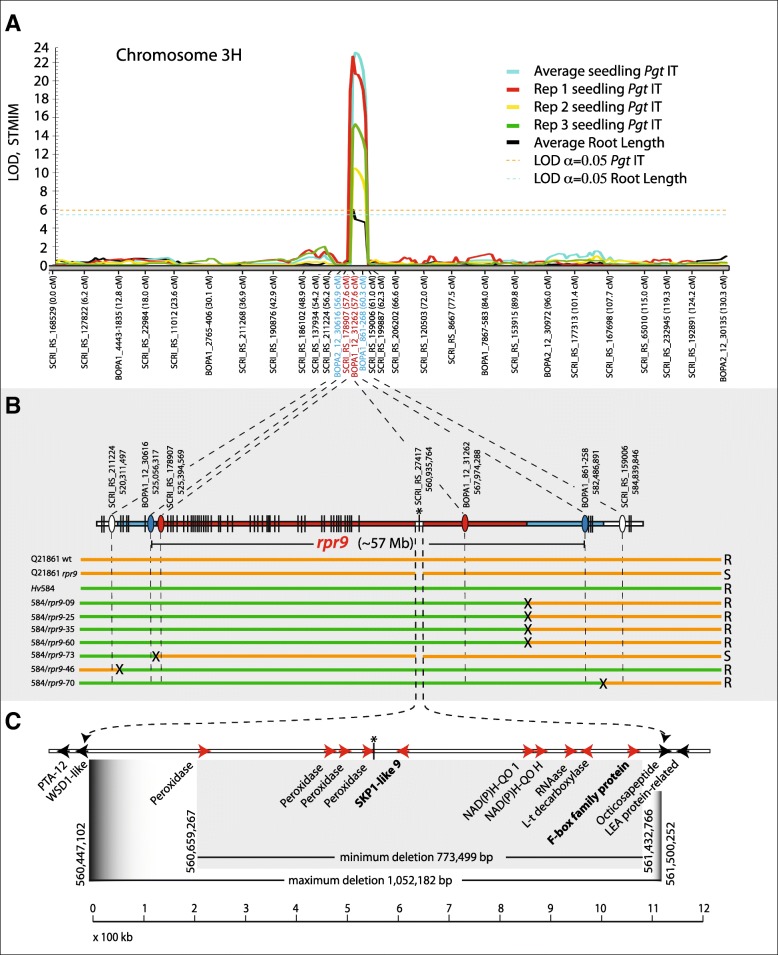
Fig. 2.
QTL and qualitative mapping of the Rpr9 region showing the deletion identified within the region. a The Y-axis represents LOD values and X-axis the chromosome 3H map with markers designated below. Three replications and average of Pgt race QCCJB infection types with stunted root length QTL mapping are shown. The colors representing individual reps and averages are shown in the upper right. Blue indicate flanking and red indicate markers associated with the QTL. b The seven recombinants delimiting rpr9 with Hv584/rpr9 designations are listed on the left with the Q21861-rpr9 and Hv584 parental lines and Q21861 wild type. The horizontal bars represent the genotypes of each (orange = Q21861 genotype and green = Hv584 genotype for markers listed above. The general reaction to Pgt race QCCJB is shown on the right (R = resistant and S = susceptible). Black Xs represent recombination regions. The horizontal bars above shows the cosegregating blocks of markers with the most distal and proximal rpr9 cosegregating markers based on genome sequence positions denoted with a red ovals and other markers shown as vertical black lines. Blue ovals denote flanking markers with the smallest physical interval. White ovals denote the next segregation blocks proximally and distally. All markers are shown in their approximate physical positions. The asterisk denotes the SCRI_RS_27,417 marker that is presents within the rpr9 deletion. c The deletion covering ten high confidence annotated genes, with functions listed below and the top rpr9 candidates indicated in bold lettering. The horizontal white bar represents the genome sequence of cv Morex with red arrows representing the relative positions and directionality of annotated rpr9 candidate genes. Black arrows the flanking genes that were present in both wildtype Q21861 and the rpr9 mutant delimiting the deletion. The black lines below denote the minimum (0.773 Mbp) and maximum (1.052 Mbp) deletion size. The 100 kilobase scale is shown below

