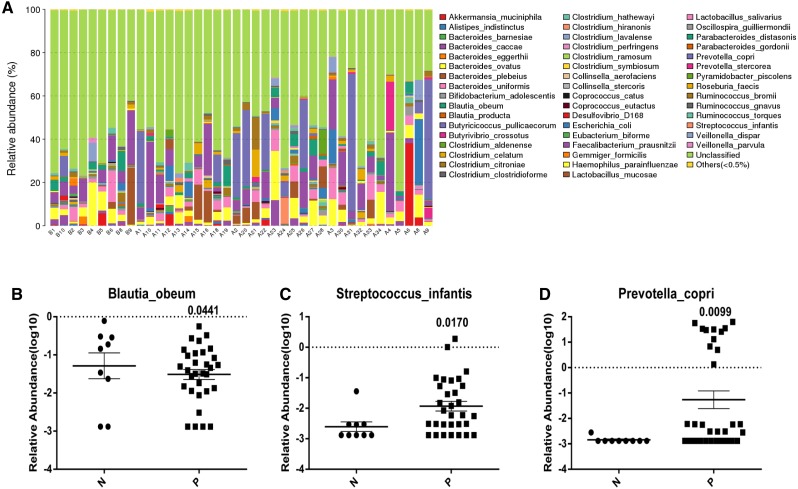
Figure 2. Analysis of the variation of intestinal gut in species level incontrols and Acute Cerebral Infarction patients.
(A) The relative abundance of each species in the intestinal gut in each sample from Acute Cerebral Infarction patients and controls (B indicates healthy people and A indicates patients); The average relative abundance of three gut microbiota (B, Blautia boeum; C, Streptococcus infantis; D, Prevotella copri) between patient group and control group. P < 0.05 was considered statistically significant in the comparison groups, N indicates normal people and P indicates patients. All the above analyses are T-test.

