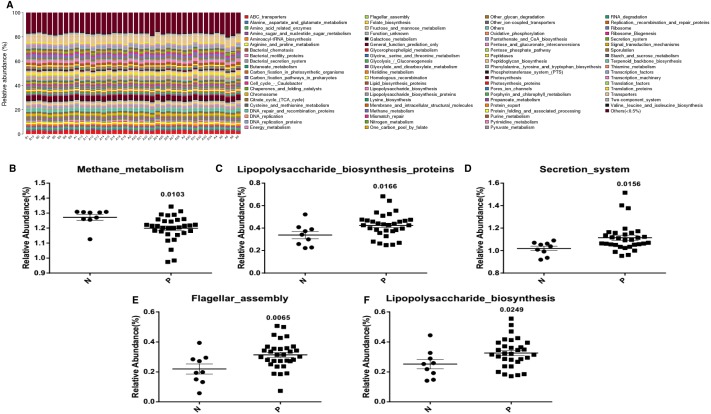
Figure 3. Pathway abundance analysis of microbial taxa with KEGG.
(A) KEGG functional pathway abundance analysis of the gut microbiota (B indicates healthy people and A indicates patients); Average pathway abundance of a gut bacterium (B, Methane_metabolism; C, Lipopolysaccharide_ biosynthesis_ proteins; D, Secretion_system; E, Flagellar_assembly; F, Lipopolysaccharide_biosynthesis) between patient group and control group. All the above analyses are T-test.

